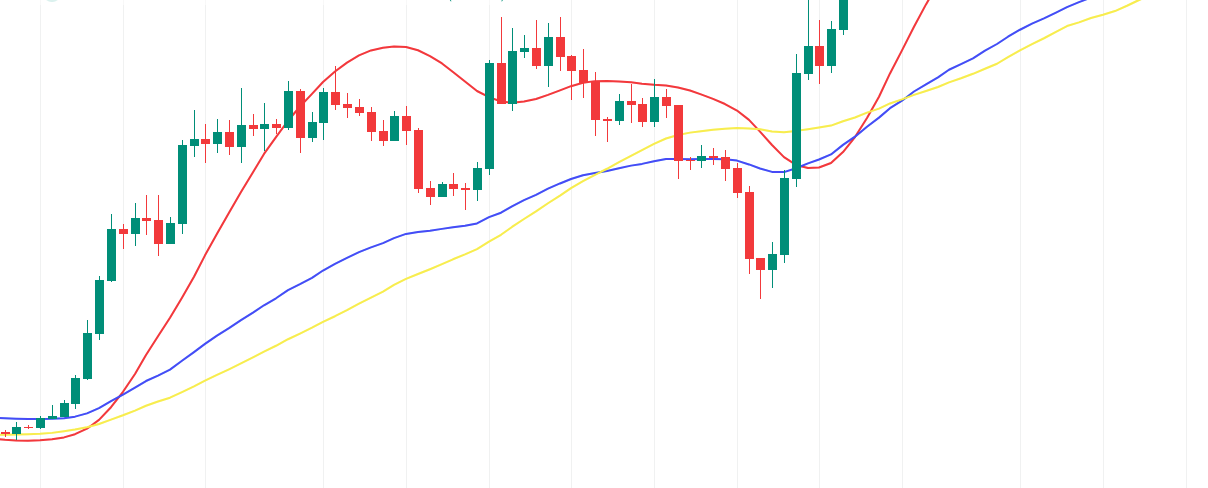
In the world of trading, deciphering the nuances between Simple Moving Averages (SMA), Exponential Moving Averages (EMA), and Hull Moving Averages (HMA) can be the difference between success and failure. These seemingly similar indicators each possess unique attributes that cater to different trading styles and objectives. Today, we embark on a journey to demystify these moving averages, shedding light on their distinct characteristics and practical applications in the realm of algorithmic trading.
Simple Moving Average (SMA)
The Simple Moving Average (SMA) is a widely used technical analysis tool in the realm of financial trading. It serves as a foundational indicator for traders seeking to identify trends, validate market direction, and generate entry and exit signals. The SMA calculates the average price of a security or asset over a specified period, typically referred to as the “lookback period.” This period can range from minutes to days, months, or even years, depending on the trader’s timeframe and objectives.
The calculation of the SMA involves summing up the closing prices of the asset over the specified period and dividing this sum by the number of data points considered. For example, a 10-day SMA would sum up the closing prices of the asset over the past 10 trading days and divide this sum by 10 to obtain the average price.
One of the key characteristics of the SMA is its simplicity and smoothness, as it assigns equal weight to each data point within the lookback period. This simplicity makes the SMA particularly useful for capturing long-term trends and filtering out short-term noise in the market.
Traders often utilize SMAs in various ways, including trend identification, trend confirmation, and generating trading signals. When the price of an asset crosses above its SMA, it may signal a potential uptrend, while a cross below the SMA could indicate a potential downtrend. Additionally, traders may look for crossovers between different SMAs with different look-back periods to confirm trend changes or generate buy and sell signals.
Exponential Moving Average
The Exponential Moving Average (EMA) is another essential tool in the toolkit of technical analysts and traders. Like the Simple Moving Average (SMA), the EMA is used to identify trends, validate market direction, and generate entry and exit signals. However, the EMA differs from the SMA in its calculation method and responsiveness to recent price movements.
The EMA places greater emphasis on more recent price data, making it more responsive to changes in market dynamics compared to the SMA. This responsiveness is achieved by applying a weighting factor to each data point within the lookback period, with more weight assigned to recent prices. As a result, the EMA reacts more quickly to price changes, allowing traders to capture short-term trends and movements more effectively.
The formula for calculating the EMA involves taking the weighted average of the asset’s closing prices over the specified period, with greater weight assigned to recent data points. This weighting factor typically follows an exponential decay function, which ensures that the most recent prices have the most significant impact on the EMA calculation.
Traders often use EMAs in conjunction with SMAs or other technical indicators to confirm trend changes, identify potential entry and exit points, and filter out market noise. For example, a bullish crossover occurs when the shorter-term EMA crosses above the longer-term EMA, signaling a potential uptrend, while a bearish crossover occurs when the shorter-term EMA crosses below the longer-term EMA, signaling a potential downtrend.
Overall, the Exponential Moving Average offers traders a more responsive and dynamic tool for analyzing market trends and making informed trading decisions, particularly in fast-moving and volatile markets.
Hull Moving Average (HMA)
The Hull Moving Average (HMA) is a relatively lesser-known but powerful indicator used in technical analysis and algorithmic trading. Developed by Alan Hull, the HMA seeks to address some of the limitations of traditional moving averages by providing a smoother and more responsive trend-following tool.
Unlike simple moving averages (SMAs) and exponential moving averages (EMAs), which calculate the average price over a specified period, the HMA applies a weighted average of two different WMA (Weighted Moving Averages) to the price data. These WMAs are calculated based on the length of the specified period and half of that period.
The formula for calculating the HMA involves three steps:
- Calculate the WMA for the full length of the specified period.
- Calculate the WMA for half the length of the specified period.
- Subtract the shorter-term WMA from twice the longer-term WMA and take the square root of the result.
This calculation method results in a moving average that is more responsive to recent price movements while also smoothing out the curve to reduce noise and false signals. The HMA achieves this by placing greater emphasis on recent price data, similar to the exponential moving average (EMA), but with added smoothing properties.
Traders often use the Hull Moving Average to identify trend reversals, confirm trend direction, and generate entry and exit signals. When the price is above the HMA, it may indicate an uptrend, while a price below the HMA may suggest a downtrend. Additionally, crossovers between the price and the HMA can signal potential changes in market direction.
Overall, the Hull Moving Average offers traders a versatile and effective tool for analyzing market trends and making informed trading decisions, particularly in volatile and fast-moving markets where responsiveness and accuracy are paramount.
Practical Applications
Simple Moving Average (SMA):
- Calculation: Equal weight to all data points within the chosen period.
- Responsiveness: Less responsive to short-term fluctuations due to its equal weighting.
- Trend Identification: Suitable for identifying longer-term trends.
- Smoothness: Provides a smoother curve, filtering out some noise.
Exponential Moving Average (EMA):
- Calculation: Assigns more weight to recent prices, making it more responsive to market shifts.
- Responsiveness: Highly responsive to short-term fluctuations and recent price movements.
- Trend Identification: Ideal for identifying short-term trends and capturing immediate shifts in market sentiment.
- Smoothness: Provides a smoother curve compared to SMA due to its focus on recent data.
Hull Moving Average (HMA):
- Calculation: Focuses on the weighted average of recent data points, providing responsiveness and smoothness.
- Responsiveness: Highly responsive to short-term fluctuations, offering quicker response times to market movements.
- Trend Identification: Effective for identifying short-term trends and capturing immediate shifts in market sentiment.
- Smoothness: Offers a smoother curve by filtering out some false signals and unnecessary noise.
Circumstances for Use:
- SMA: Use when seeking to identify longer-term trends and prefer a smoother curve with less responsiveness to short-term fluctuations.
- EMA: Opt for EMA when aiming to capture short-term opportunities, identify short-term trends, and prefer a more responsive curve to recent price movements.
- HMA: Choose HMA for quick response times to market movements, effective identification of short-term trends, and a smoother curve with responsiveness to short-term fluctuations.
Examples from our strategies
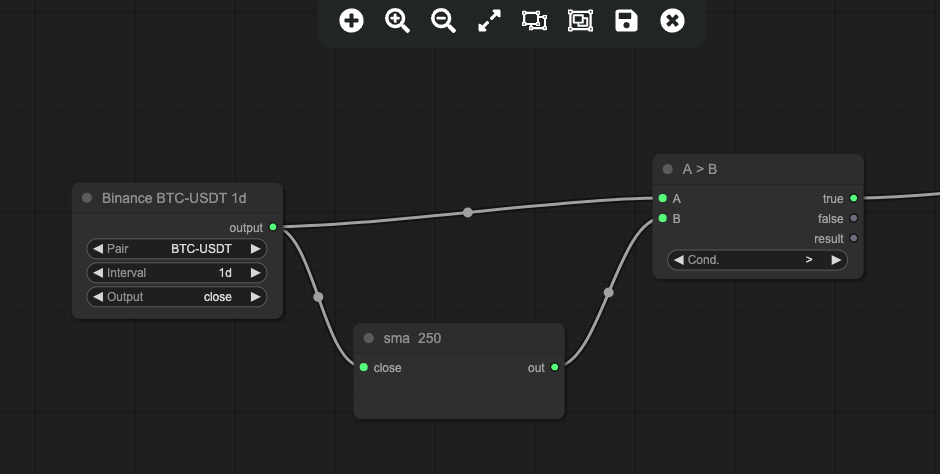
By incorporating a rule that checks whether the current price exceeds the long SMA, traders can effectively validate overarching trends in the market. This condition serves as a valuable signal for identifying sustained uptrends, guiding traders in making informed decisions on potential entry or exit points.
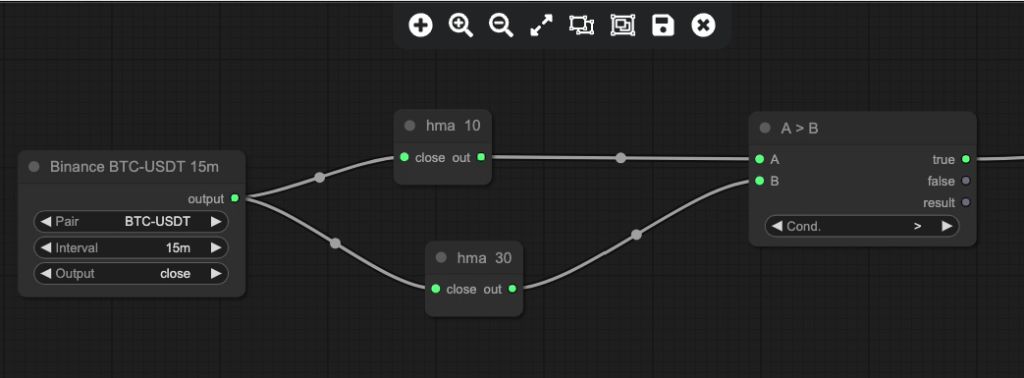
In contrast, our example for shorter-term strategies highlighted the utility of the EMA. Specifically, we implemented a rule that compares the 10-period EMA to the 30-period EMA. By triggering a buy signal when the 10-period EMA surpasses the 30-period EMA, traders can capitalize on short-term market shifts and immediate price movements. This dynamic approach enables traders to adapt swiftly to changing market conditions and seize short-term trading opportunities.
The choice between SMA, EMA, and HMA depends on your trading strategy objectives, timeframe preferences, and risk tolerance. Experiment with different combinations and parameters to find the best configuration for your specific trading approach and market conditions.
Leave a Reply