Since the market crash over the weekend, we’ve seen promising signs of recovery. Today, I’m going to share three indicators you could have used to spot this recovery and potentially make profits.
Bitcoin, which dipped from highs of $65k on Thursday to below $50k yesterday, is now back up to $56k. While it’s not yet at last week’s levels, the signs of a potential bounce back are evident.
Why Did the Markets Crash?
The global market sell-off of August 2024 was driven by multiple factors. Weak economic data from the US, particularly disappointing job growth figures, raised fears of a recession. The Federal Reserve’s decision to maintain high interest rates, despite other central banks like the Bank of England cutting rates, added to the uncertainty. High interest rates can slow borrowing and spending, further impacting economic growth. Additionally, significant losses in the tech sector, global economic uncertainty, and overvaluation concerns led to widespread declines. The Nikkei 225 in Japan experienced a historic drop of 12.4%, partly due to the Bank of Japan’s policy shift and profit-taking after a prolonged rally. Read more here!
Indicators for success
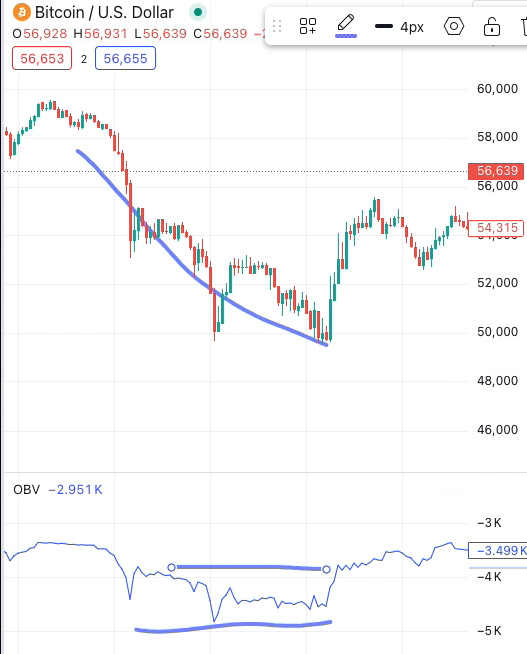
1. On-Balance Volume (OBV)
The first indicator to watch was the 15-minute On-Balance Volume (OBV). On Monday, as the market hit its bottom, we observed divergence between the OBV and the price. While the price was making lower lows, the OBV was flattening out, suggesting that buying pressure was catching up to selling pressure. This divergence often indicates a potential reversal. Learn more about OBV.
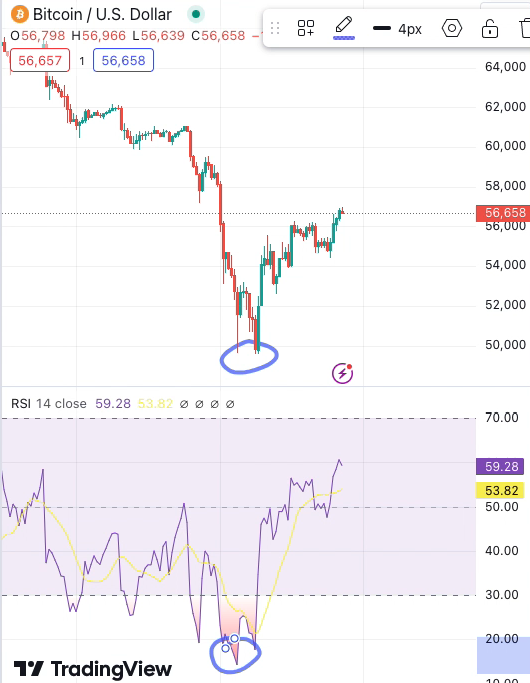
2. Relative Strength Index (RSI)
The second indicator was the 1-hour Relative Strength Index (RSI), which hit a low of around 18. The RSI is a momentum oscillator that measures the speed and change of price movements. A low RSI indicates that an asset is oversold, suggesting a potential reversal. An RSI of 18 was a strong signal that Bitcoin was significantly oversold, hinting at a possible recovery. Learn more about RSI.
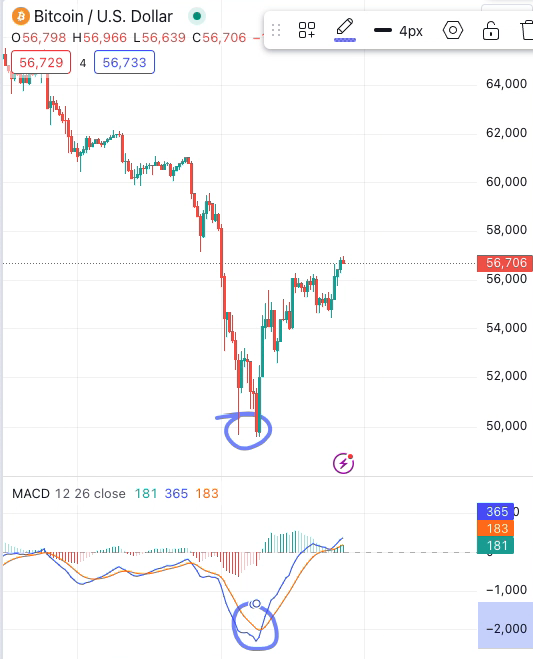
3. Moving Average Convergence Divergence (MACD)
Lastly, the 1-hour Moving Average Convergence Divergence (MACD) line crossed over its signal line at the same time. This crossover is a classic signal of a potential bullish reversal, indicating that the downward momentum is weakening and a move upwards could be on the horizon. Learn more about MACD.
These indicators combined provided strong signals that a recovery might have been on the way. If timed right, you could have capitalized on the 14% upswing.
Trading Without Emotions
In volatile markets, trading without emotions is crucial. Emotional trading can lead to impulsive decisions, often resulting in significant losses. Automated trading platforms like Arrow Algo can help. Arrow Algo lets you build, backtest, and run automated trading strategies without needing to know how to write code. It sends buy and sell signals to your exchange based on the strategies you’ve set, ensuring disciplined and consistent trading.
The recent market recovery highlights the importance of using technical indicators to make informed trading decisions. While we still don’t know if this recovery is a correction within a continuing bull trend or just the end of a bear trap, using tools like RSI, MACD, and OBV can help you navigate these uncertain times.
By leveraging automated trading platforms like Arrow Algo, you can remove the emotional component from trading, ensuring more rational and effective investment decisions.
Stay informed, stay prepared, and happy trading!
Did you enjoy this? You may like: