In the world of trading, every chart tells a story, and every indicator holds a clue to market behaviour. Among the arsenal of tools available to traders, one stands out for its simplicity yet profound insights: the Relative Strength Index (RSI).
Developed by J. Welles Wilder Jr. in the late 1970s, the RSI has since become a staple in the toolkit of technical analysts, offering a window into market strength and momentum. In this article, we delve into the depths of the RSI, exploring its conceptual foundation, practical applications, and potential to revolutionise trading strategies.
Understanding RSI: The Basics
Definition of RSI
The Relative Strength Index (RSI) is a momentum oscillator that measures the speed and change of price movements. It oscillates between 0 and 100 and is used to identify overbought or oversold conditions in an asset.
How RSI Works
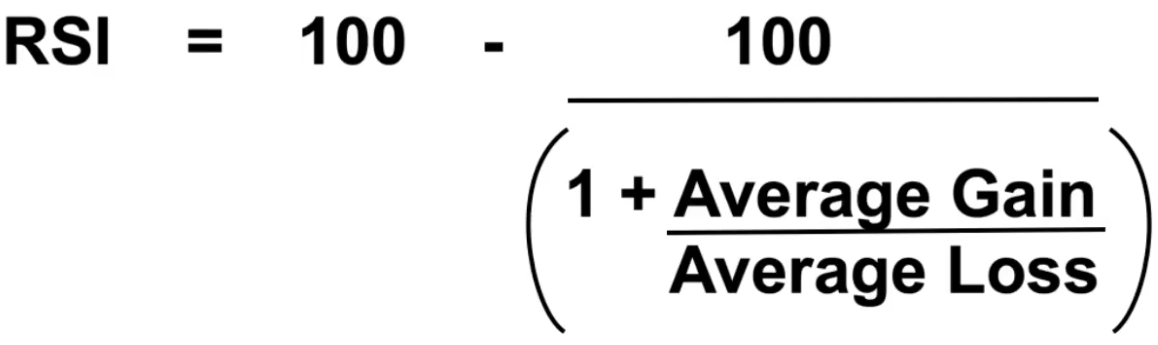
RSI is calculated based on the average gains and losses over a specified period, typically 14 days. The formula for RSI involves dividing the average gain by the average loss over the chosen time frame.
RSI: A Momentum Indicator
As a momentum indicator, RSI helps traders assess the strength of a trend and identify potential trend reversals. It provides valuable insights into market sentiment and can be used to make informed trading decisions. For a detailed guide on the best ways to combine different types of indicators, read our blog post on the subject.
Pros, Cons, and Uses of RSI
Pros of RSI
- Simple Interpretation: RSI is easy to understand and interpret, making it accessible to traders of all levels.
- Effective for Overbought/Oversold Conditions: RSI is particularly useful for identifying overbought and oversold conditions, allowing traders to anticipate potential reversals.
- Versatile: RSI can be applied to various time frames and assets, making it versatile for different trading strategies.
- Confirmation Tool: RSI can confirm trends identified by other technical indicators, providing additional validation for trading decisions.
Cons of RSI
- Whipsawing: RSI may generate false signals, especially in choppy or sideways markets, leading to whipsawing and potential losses.
- Not Always Timely: RSI signals may not always occur at the exact turning points of a trend, resulting in missed opportunities or premature exits.
- Lagging Indicator: RSI is a lagging indicator, meaning it may not accurately predict future price movements and may only confirm trends after they have already begun.
Practical Uses of RSI
- Trend Confirmation: RSI can confirm the strength and direction of a trend identified by other indicators or chart patterns.
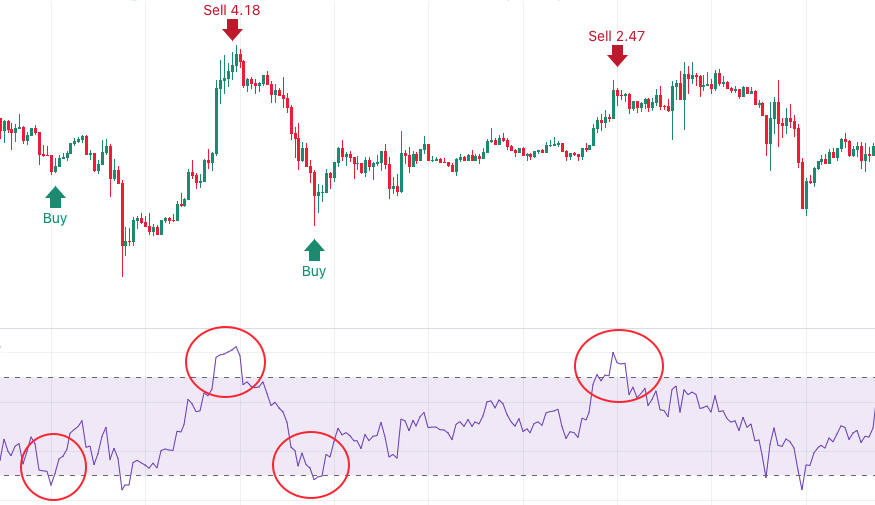
- Overbought/Oversold Conditions: RSI helps identify when an asset is overbought (RSI above 70) or oversold (RSI below 30), indicating potential reversal points.
- Divergence Analysis: RSI divergence, where price movements diverge from RSI movements, can signal potential trend reversals.
- Signal Validation: RSI can be used to validate buy or sell signals generated by other technical indicators, enhancing the accuracy of trading decisions.
Practical examples for RSI in Trading Strategies
Validating Market Trends
One practical application of RSI in trading strategies is to validate market trends. By analysing the long-term RSI over a significant period, such as 250 periods, traders can gauge whether the market is in bullish or bearish territory. Here’s how you can implement this validation:
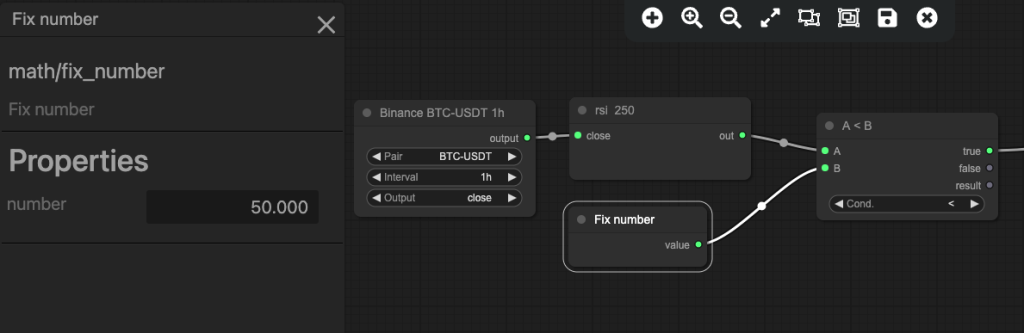
By checkin whether the long term RSI (here using 250x 1 hour candles) is more than 50, we can validate whether the average gains are outweighing average losses over a sustained period, which indicates we have bullish conditions for our trade.
Signal Validation
Another practical use of RSI is in signal validation for entry and exit points. Traders often rely on short-term RSI readings, such as those over 15-minute intervals, to identify potential buying or selling opportunities. Here’s how you can validate signals using RSI:
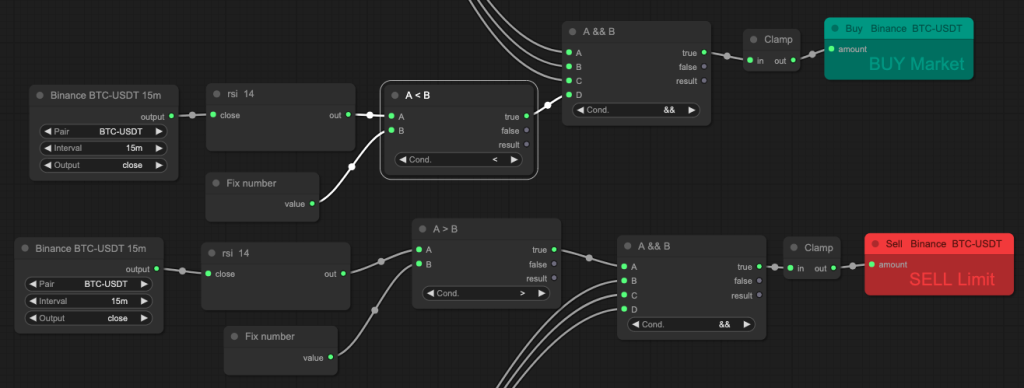
By checking whether RSI is above 70 or under 30, in a 15 minute chart, we can confirm the short term momentum and use this as a filter to make sure are signals are being generate in appropriately overbought or oversold conditions.
Tips for Effective Use of RSI
- Combine RSI with Other Indicators: RSI is powerful when combined with complementary indicators like Trend based indicators such as Moving Average Convergence Divergence (MACD) or Volume indicators like On Balance Volume (OBV). This integration provides a more comprehensive view of market conditions, enhancing the accuracy of trading signals. For a detailed guide on the best ways to combine different types of indicators, read our blog post on the subject.
- Thoroughly Backtest Strategies: Before implementing any RSI-based strategy, conduct thorough backtesting across different market conditions. This helps validate the effectiveness of the strategy and identifies potential weaknesses or areas for improvement.
- Exercise Caution and Stay Informed: While RSI can provide valuable insights, it’s essential to exercise caution and avoid relying solely on RSI signals. Keep abreast of market news, economic indicators, and geopolitical events to make informed trading decisions alongside RSI analysis.
Conclusion
In conclusion, the Relative Strength Index (RSI) serves as a valuable tool for traders seeking to gauge market momentum and identify potential entry and exit points. By understanding the basics of RSI, recognizing its pros and cons, and implementing effective strategies, traders can enhance their trading performance. Remember to utilize RSI in conjunction with other indicators, thoroughly backtest your strategies, and stay informed about market developments. With careful consideration and practice, RSI can be a valuable asset in your trading toolkit. Happy trading!
Leave a Reply