In the dynamic realm of financial markets, traders are constantly seeking tools and indicators to decipher market trends and make informed trading decisions. One such tool that stands out is the Moving Average Convergence Divergence (MACD). Originating in the 1970s, MACD has become a staple in the toolkit of many traders, offering insights into trend strength, momentum, and potential reversals.
With its three key components – the MACD line, the signal line, and the histogram – MACD provides a comprehensive view of market dynamics, allowing traders to identify opportunities for entry and exit. In this guide, we delve into the intricacies of MACD, exploring its fundamentals, practical applications, and tips for effective use. Whether you’re a novice trader or a seasoned investor, understanding MACD can enhance your trading strategies and pave the way for more confident decision-making in the financial markets.
Understanding MACD: The Basics
In dissecting the Moving Average Convergence Divergence (MACD), it’s crucial to grasp its fundamental components, each playing a vital role in interpreting market dynamics and potential trading opportunities.
The MACD Line
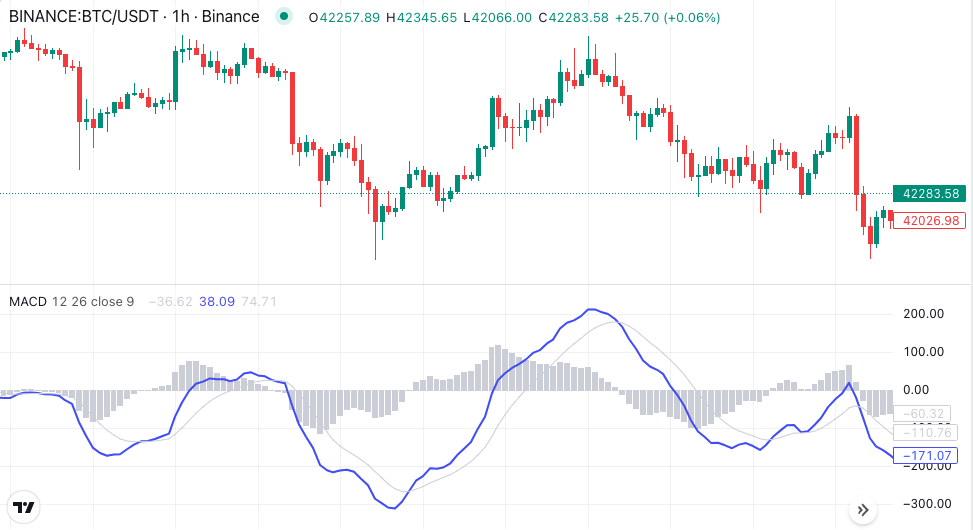
At the heart of MACD lies the MACD line, derived from the difference between two exponential moving averages (EMAs) – typically the 12-day EMA and the 26-day EMA. This line serves as a barometer of short-term price momentum relative to the longer-term trend. A rising MACD line suggests increasing bullish momentum, while a falling MACD line indicates growing bearish sentiment.
The Signal Line
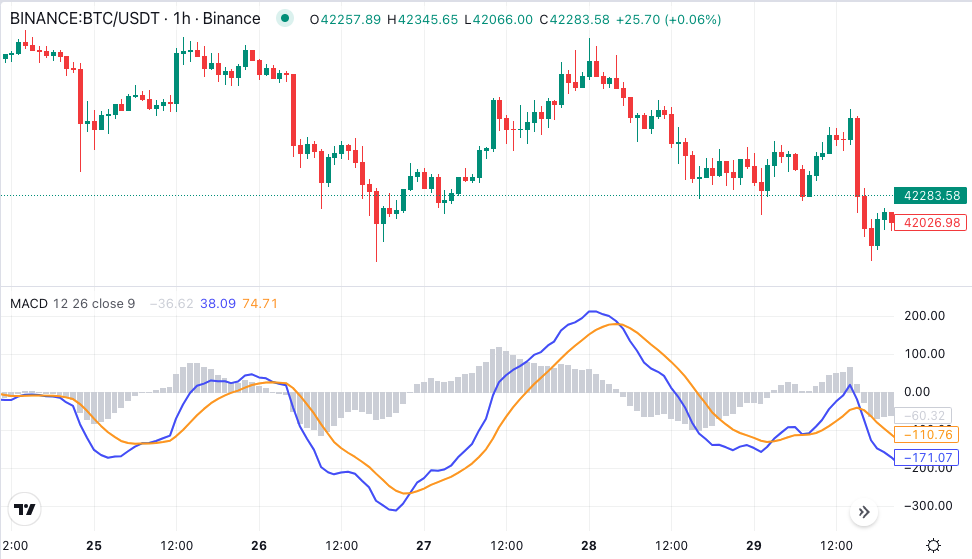
Complementing the MACD line is the signal line, often represented as a 9-day EMA of the MACD line. This line acts as a smoothing mechanism, providing a clearer indication of trend direction and potential reversals. Crossovers between the MACD line and the signal line serve as key signals for entry and exit points in trading strategies.
The Histogram
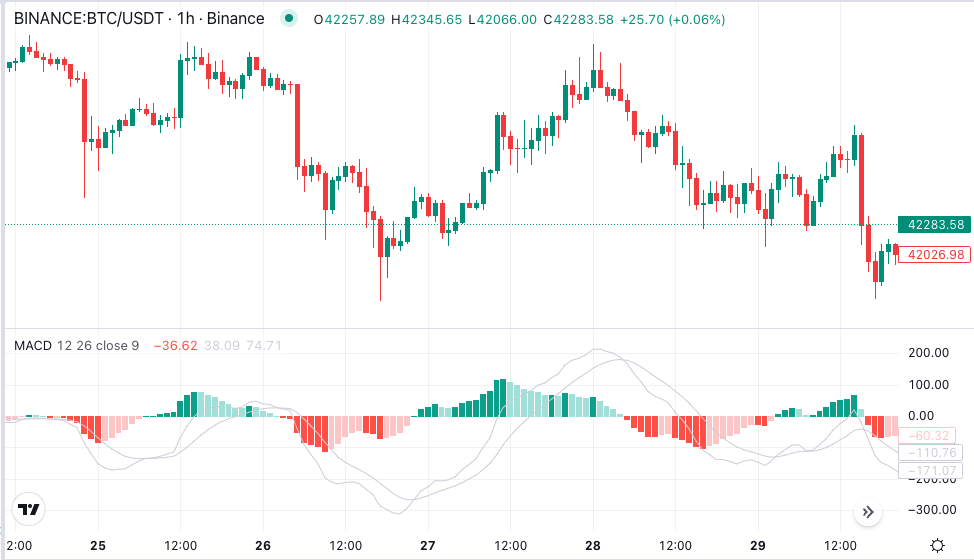
The histogram, displayed as bars beneath the MACD chart, illustrates the difference between the MACD line and the signal line. A positive histogram indicates bullish momentum, with the height of the bars representing the magnitude of the difference. Conversely, a negative histogram signals bearish momentum. Traders often use histogram patterns to confirm trends and anticipate changes in market sentiment.
Pros, Cons, and Uses of MACD
Pros:
- Simple to Understand: MACD’s straightforward calculation and visual representation make it accessible to traders of all experience levels, allowing for easy interpretation of market trends and potential trading signals.
- Versatile Indicator: MACD can be applied to various financial instruments and timeframes, making it adaptable to different trading strategies and market conditions.
- Effective Trend Identification: MACD excels in identifying trends and momentum shifts, providing traders with valuable insights into potential entry and exit points in trending markets.
- Leading Indicator: As a leading indicator, MACD often provides early signals of trend reversals or continuations, empowering traders to anticipate market movements and make timely trading decisions.
Cons:
- Whipsaw Signals: During periods of low volatility or choppy price action, MACD may generate false or premature signals, leading to potential losses for traders who rely solely on its indications.
- Lagging Nature: While MACD is effective in identifying trends, it may lag behind price movements, resulting in delayed signals and missed trading opportunities, especially in fast-moving markets.
- Over-reliance Risk: Traders must exercise caution not to rely solely on MACD for trading decisions but instead use it in conjunction with other indicators and analysis methods to confirm signals and validate trends.
Practical Uses:
- Trend Confirmation: MACD is widely used to confirm the direction of trends, with crossovers between the MACD line and the signal line serving as signals of potential trend changes.
- Entry and Exit Signals: Traders often utilise MACD crossovers and histogram patterns to determine optimal entry and exit points for trades, enhancing the precision of their trading strategies.
- Divergence Analysis: MACD divergence, where price movements deviate from MACD signals, can indicate potential trend reversals or continuations, offering traders additional insights into market dynamics.
- Risk Management: By incorporating MACD into risk management strategies, traders can set stop-loss levels and adjust position sizes based on MACD signals, helping to minimise potential losses and maximise profits.
Overall, while MACD has its limitations, its simplicity, versatility, and effectiveness in trend identification make it a valuable tool for traders seeking to navigate the complexities of the financial markets.
Utilising MACD in Trading Strategies
MACD (Moving Average Convergence Divergence) is a versatile indicator that can be incorporated into various trading strategies to enhance decision-making and improve trading outcomes. Here, we explore two common methods of utilising MACD in trading strategies, along with live examples and backtesting results.
Method 1: Cross-over Signals
One of the most popular ways to use MACD is by monitoring cross-over signals between the MACD line and the signal line. When the MACD line crosses above the signal line, it generates a bullish signal, suggesting a potential uptrend. Conversely, when the MACD line crosses below the signal line, it indicates a bearish signal, signalling a potential downtrend.
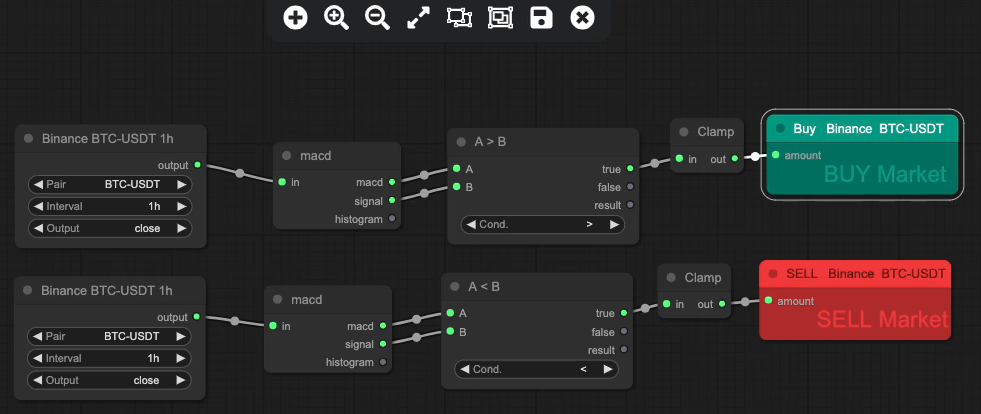
In this strategy, we feed the closing price of the asset into a MACD indicator block and use the MACD line and the signal line to generate buy and sell signals based on their cross-overs. By backtesting this strategy over historical data, we can evaluate its performance and assess its effectiveness in real-market conditions.
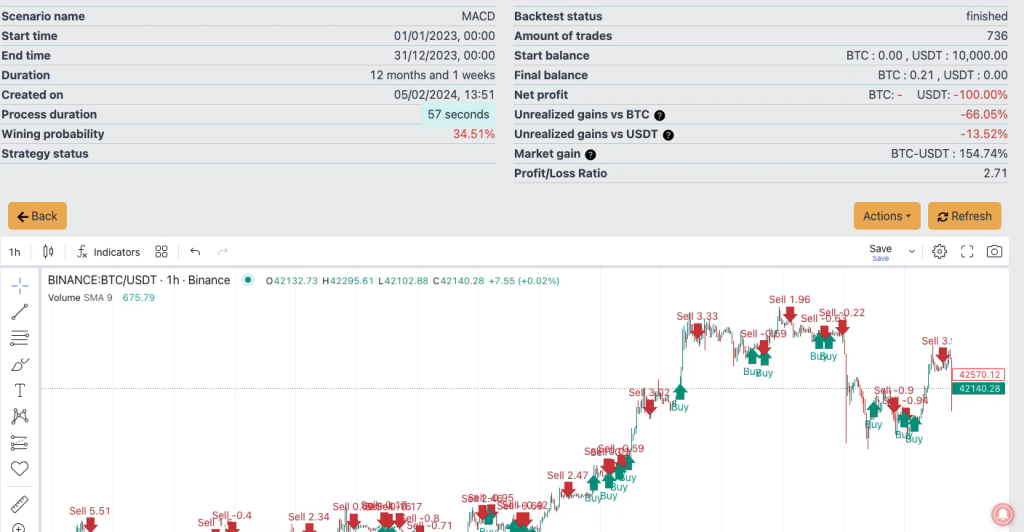
This simple strategy generated 736 trades in a 1 year period. Although there are nice gains within the results, we need to filter out some of the noise and ensure that we are only trading in bullish conditions.
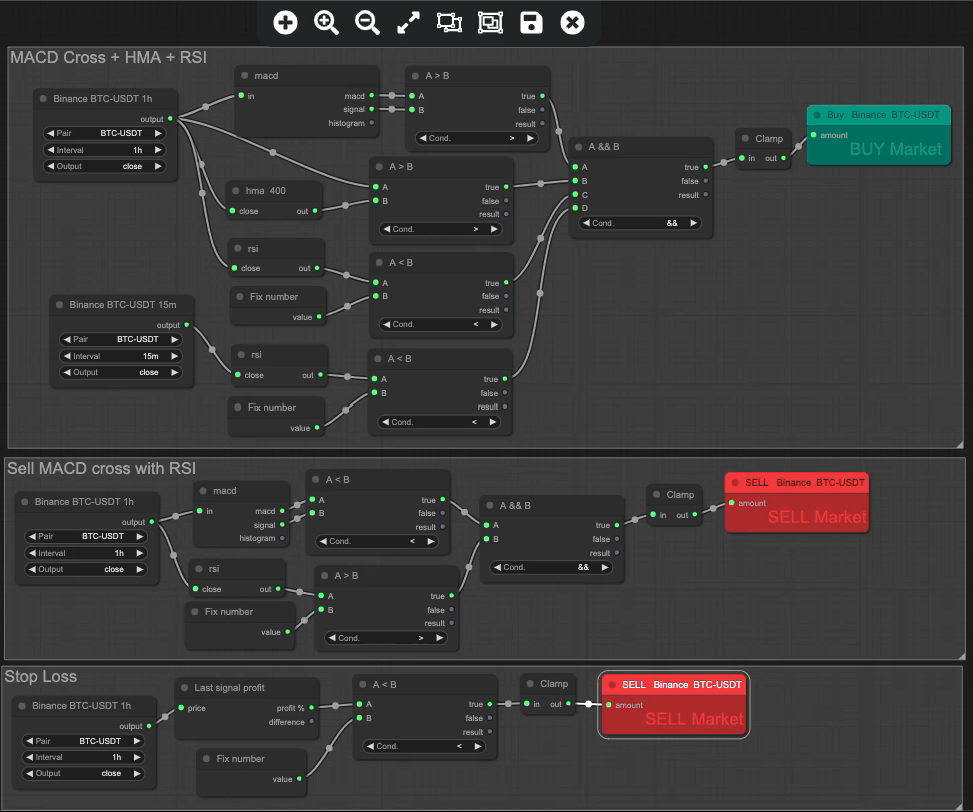
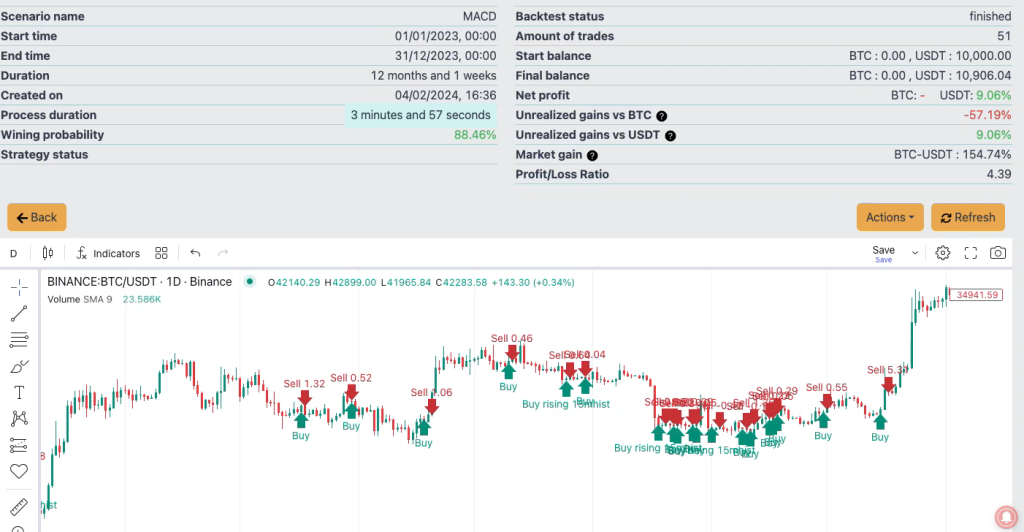
By adding in a few simple validators into the rule set using HMA and RSI, as well as a stop loss, we can achieve this. Producing a more effective 88.46% over the same period.
Method 2: Histogram Analysis
Another method of utilising MACD is by analysing the histogram, which represents the difference between the MACD line and the signal line. By monitoring the histogram’s movements, traders can identify shifts in momentum and potential trend reversals.
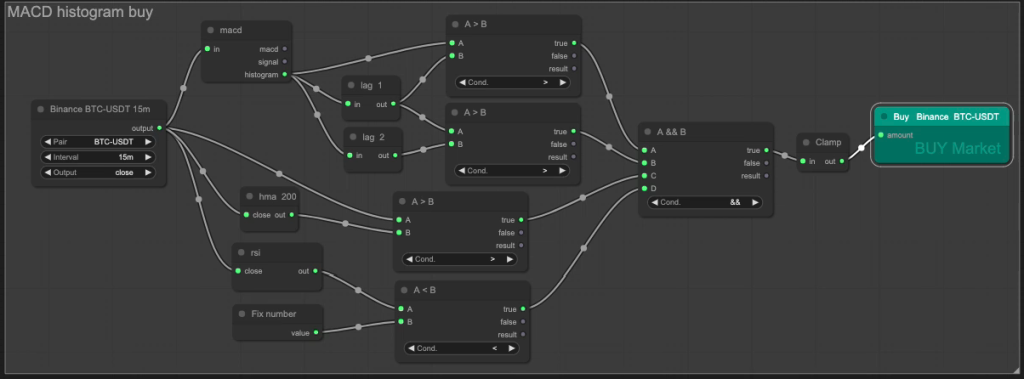
In this strategy, we focus on the histogram’s behaviour, looking for patterns such as increasing or decreasing histogram bars. We feed the closing price of the asset into a MACD indicator block and analyse this histogram’s value, along side the previous 2 values through lag blocks, to track movements to generate buy and sell signals when we know there is a continually increasing or decreasing value. Through backtesting, we can validate the strategy’s effectiveness and fine-tune its parameters for optimal performance.
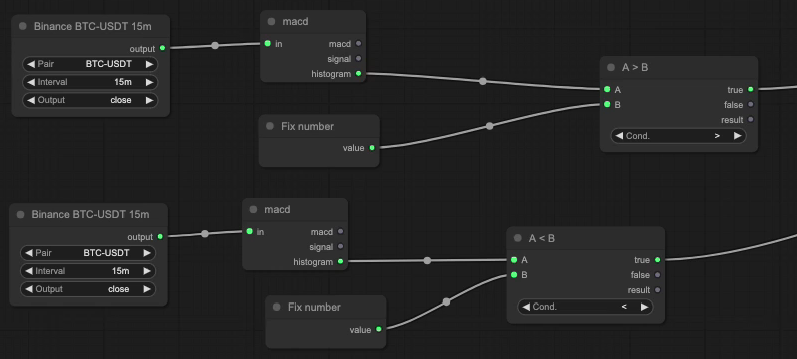
Alternatively, we can simply check whether the histogram is above or below zero, or any other value by comparing it to a fixed number block.
By incorporating MACD into trading strategies using these methods, traders can leverage its predictive power and versatility to make informed decisions and achieve consistent results in the dynamic world of financial markets.
Tips for Effective Use of MACD
Effectively utilising the MACD (Moving Average Convergence Divergence) indicator can significantly enhance trading decisions and improve overall performance. Here are some tips for maximising the effectiveness of MACD in your trading endeavours:
1. Combine with Other Indicators: While MACD can be a powerful standalone indicator, combining it with other technical indicators can provide additional confirmation and validation of trading signals. Consider integrating MACD with indicators such as moving averages, RSI (Relative Strength Index), or Bollinger Bands to strengthen your analysis and increase the accuracy of your trading decisions. For a detailed guide on the best ways to combine different types of indicators, read our blog post on the subject.
2. Thoroughly Backtest Strategies: Before implementing any trading strategy based on MACD signals, it is essential to thoroughly backtest it using historical data. Backtesting allows traders to evaluate the strategy’s performance under various market conditions and assess its robustness and reliability. By conducting rigorous backtesting, traders can identify potential weaknesses or flaws in the strategy and make necessary adjustments to improve its effectiveness.
3. Stay Informed: Stay updated with market news, economic events, and other factors that may impact asset prices and market trends. MACD signals are influenced by market dynamics and external factors, so it is crucial to stay informed and aware of any developments that could affect trading conditions. Regularly monitor market trends, conduct technical analysis, and adjust your trading strategy accordingly to adapt to changing market conditions and maximise profitability.
By following these tips, traders can leverage the full potential of MACD as a powerful tool for technical analysis and make more informed and profitable trading decisions in the financial markets.
Conclusion
In conclusion, the Moving Average Convergence Divergence (MACD) indicator is a versatile and powerful tool that can provide valuable insights into market trends, momentum, and potential trading opportunities. With its three components – the MACD line, the Signal line, and the Histogram – MACD offers a comprehensive view of price action and helps traders identify trend reversals, confirm trends, and filter out noise.
Despite its simplicity, MACD is highly effective when used correctly in trading strategies. By understanding its basic principles and nuances, traders can leverage MACD signals to make more informed and profitable trading decisions. Whether used alone or in conjunction with other technical indicators, MACD can significantly enhance the accuracy and reliability of trading strategies.
However, it is essential for traders to exercise caution and perform thorough analysis before relying solely on MACD signals for trading decisions. Like any technical indicator, MACD is not infallible and may produce false signals, particularly in choppy or range-bound markets. Therefore, it is crucial to combine MACD with other indicators, conduct thorough backtesting, and stay informed about market developments to ensure consistent success in trading.
Overall, MACD remains a valuable tool in the arsenal of every trader, offering a simple yet effective way to analyse market trends and identify profitable trading opportunities. By incorporating MACD into their trading strategies and following best practices for its use, traders can navigate the financial markets with confidence and achieve their trading goals.
Did you enjoy this?
Read some of our other articles on other indicators:
Unveiling the Mystery Behind Simple vs Exponential vs Hull Moving Average
Master Relative Strength Index (RSI) to Unlock Profits Trading
On Balance Volume (OBV): The Most Underutilised Indicator in Trading
What is the Super Trend Indicator? How can you make profit with it?
The Best Indicator to use in Trading?