Are you ready to delve into the world of trading indicators and unlock the power of the Super Trend? If so, you’re in the right place! In this comprehensive guide, we’ll take you on a journey through the fascinating realm of the Super Trend indicator, breaking down its intricacies and revealing how it can be a game-changer for your trading strategies.
For both novice and experienced traders alike, understanding how indicators function is crucial for making informed decisions in the dynamic world of financial markets. And among the myriad of tools available, the Super Trend stands out for its simplicity, effectiveness, and versatility.
For those eager to explore the world of trading indicators further, we also offer a guide to different types of indicators here. Whether you’re interested in oscillators, moving averages, or volume-based indicators, our comprehensive resources cover a wide range of tools to suit your trading style. Dive deeper into the world of technical analysis and discover the tools that best align with your trading goals.
By the end of this guide, you’ll have a firm grasp of what the Super Trend indicator is, how it’s calculated, its pros and cons, practical applications in algorithmic trading, and much more. Get ready to supercharge your trading journey with the Super Trend indicator!
What is Super Trend?
The Super Trend indicator is a popular trend-following tool used by traders to identify the direction of market trends. It effectively combines price action and volatility to provide insights into potential trend reversals or continuations. Unlike traditional moving averages, the Super Trend adapts dynamically to changing market conditions, making it particularly useful for capturing trends in volatile markets.
Calculation: The Super Trend indicator is calculated using two primary components: the Average True Range (ATR) and a multiplier. Here’s how it’s calculated:
- Calculate the Average True Range (ATR) over a specified period, typically 14 periods.
- Multiply the ATR by a predetermined multiplier (e.g., 2).
- Add the result to the period’s high price to obtain the upper band.
- Subtract the result from the period’s low price to obtain the lower band.
- The Super Trend line is then plotted based on these upper and lower bands.
Worked Examples: Let’s consider an example with hypothetical prices:
- High Price: $50
- Low Price: $40
- ATR: $3 (calculated using historical price data)
- Multiplier: 2
- Calculate the Upper Band: Upper Band = High Price + (ATR * Multiplier) = $50 + ($3 * 2) = $50 + $6 = $56
- Calculate the Lower Band: Lower Band = Low Price – (ATR * Multiplier) = $40 – ($3 * 2) = $40 – $6 = $34
In this example, the Super Trend line would be plotted between $34 and $56 on the price chart, dynamically adjusting as new price data becomes available. Traders can interpret the Super Trend line’s direction and positioning relative to the price to make informed trading decisions.
Pros, Cons, and Uses of Super Trend
Pros:
- Trend Identification: One of the primary advantages of the Super Trend indicator is its ability to identify trends effectively. By dynamically adjusting to market conditions, it helps traders spot both short-term and long-term trends, enabling them to capitalize on potential price movements.
- Simple to Use: Unlike some complex technical indicators, the Super Trend is relatively simple to understand and interpret. Traders can easily incorporate it into their trading strategies without requiring advanced technical analysis knowledge.
- Adaptive Stop Loss: The Super Trend line serves as a dynamic stop-loss mechanism, automatically adjusting to changes in volatility. This feature helps traders manage risk more effectively by providing a clear exit signal when the market trend reverses.
- Reduces Noise: By filtering out minor price fluctuations and focusing on significant trend movements, the Super Trend indicator helps traders avoid false signals and noise in the market, leading to more accurate trading decisions.
- Versatile: The Super Trend can be applied to various financial instruments and timeframes, making it suitable for traders with different trading styles and preferences.
Cons:
- Lagging Indicator: Like many trend-following indicators, the Super Trend may lag behind actual price movements, especially during periods of rapid market fluctuations. This lag can result in delayed entry or exit signals, potentially impacting trading performance.
- Whipsaws: In choppy or ranging markets, the Super Trend indicator may generate false signals, known as whipsaws, leading to losses for traders who rely solely on its signals without considering market context.
- Optimization Required: While the default parameters of the Super Trend indicator work well in many market conditions, traders may need to optimize the settings (such as the period and multiplier) based on the specific asset being traded and prevailing market conditions.
Uses:
- Trend Following: The Super Trend indicator is commonly used by trend-following traders to identify and ride existing market trends. Traders can enter long positions when the price is above the Super Trend line in an uptrend and short positions when the price is below the line in a downtrend.
- Risk Management: As a dynamic stop-loss tool, the Super Trend helps traders manage risk by providing clear exit signals. Traders can use the indicator to set trailing stop-loss orders, allowing them to lock in profits and minimize potential losses as the trend develops.
- Confirmation Tool: The Super Trend indicator can act as a confirmation tool when used in conjunction with other technical indicators or trading strategies. Traders often look for alignment between the Super Trend signal and other indicators to increase the reliability of their trading decisions.
- Volatility Assessment: By factoring in market volatility, the Super Trend indicator provides insights into the strength and stability of a trend. Traders can assess the volatility of the market by observing the distance between the price and the Super Trend line, helping them gauge potential price movements.
Practical Applications of Super Trend
Single Super Trend Strategy:
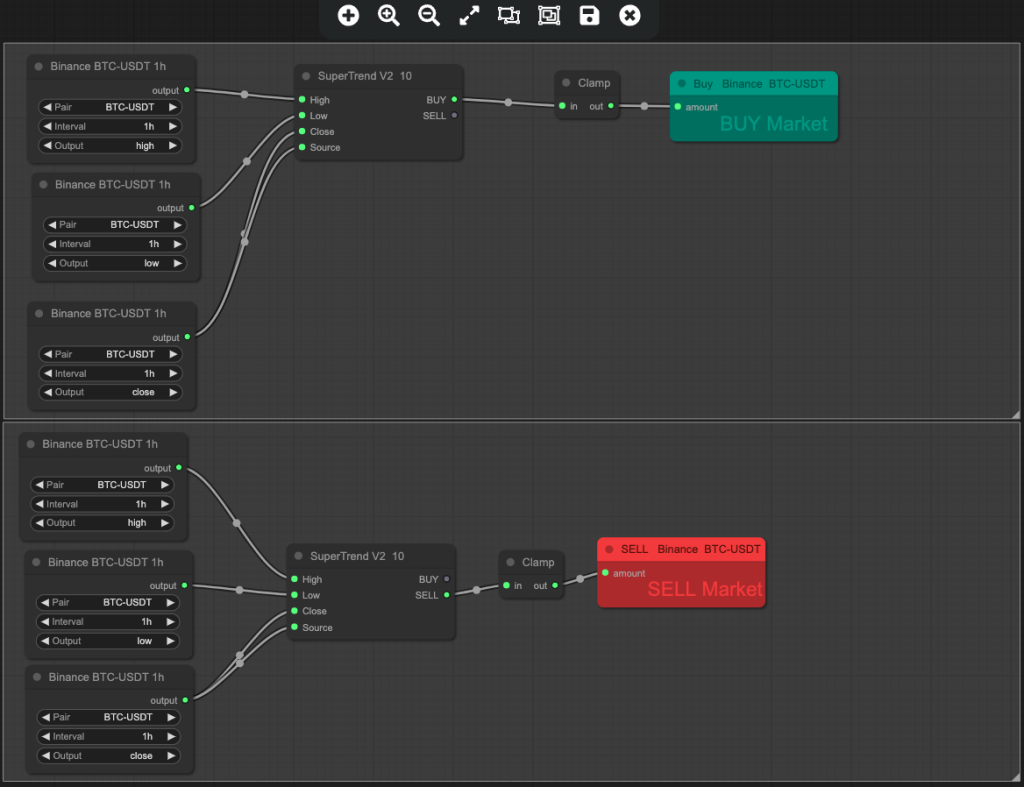
One of the simplest and most common ways to utilize the Super Trend indicator is through a single Super Trend strategy. In this approach, traders deploy a single instance of the Super Trend indicator with predefined parameters to generate buy and sell signals based on the prevailing market trend.
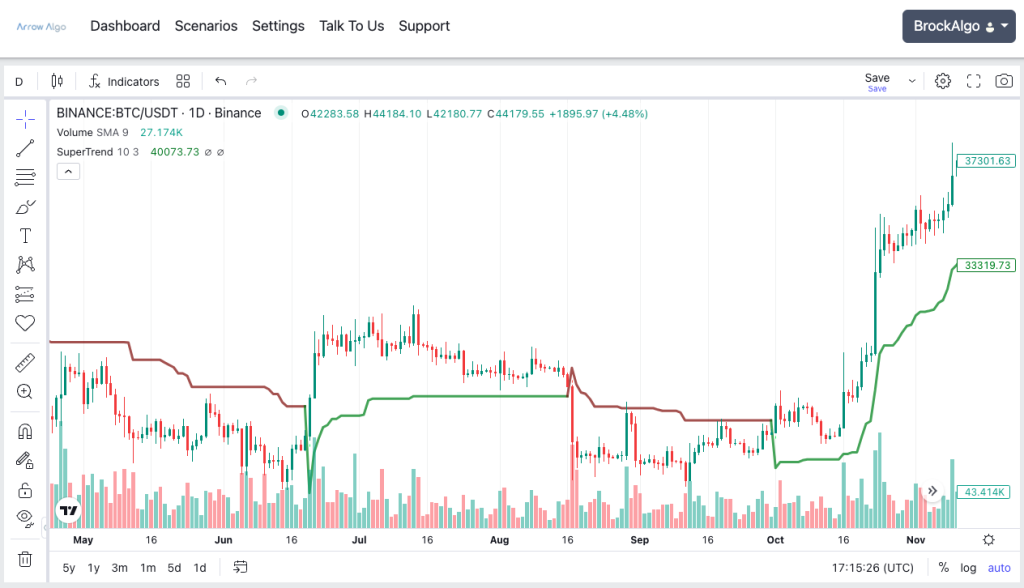
To illustrate, let’s consider a scenario where a trader employs a Super Trend indicator with a period of 10 and a multiplier of 3 on a 1-hour timeframe chart of a particular asset. In this setup, the Super Trend indicator calculates its values based on the high, low, and closing prices of each hourly candle, along with the specified parameters.
When the price is above the Super Trend line, it indicates a bullish trend, signaling a potential buying opportunity. Conversely, when the price falls below the Super Trend line, it suggests a bearish trend, prompting traders to consider selling or shorting the asset.
By following these buy and sell signals generated by the Super Trend indicator, traders can capture trends and capitalize on price movements in the market.
Multi Super Trend Strategy:
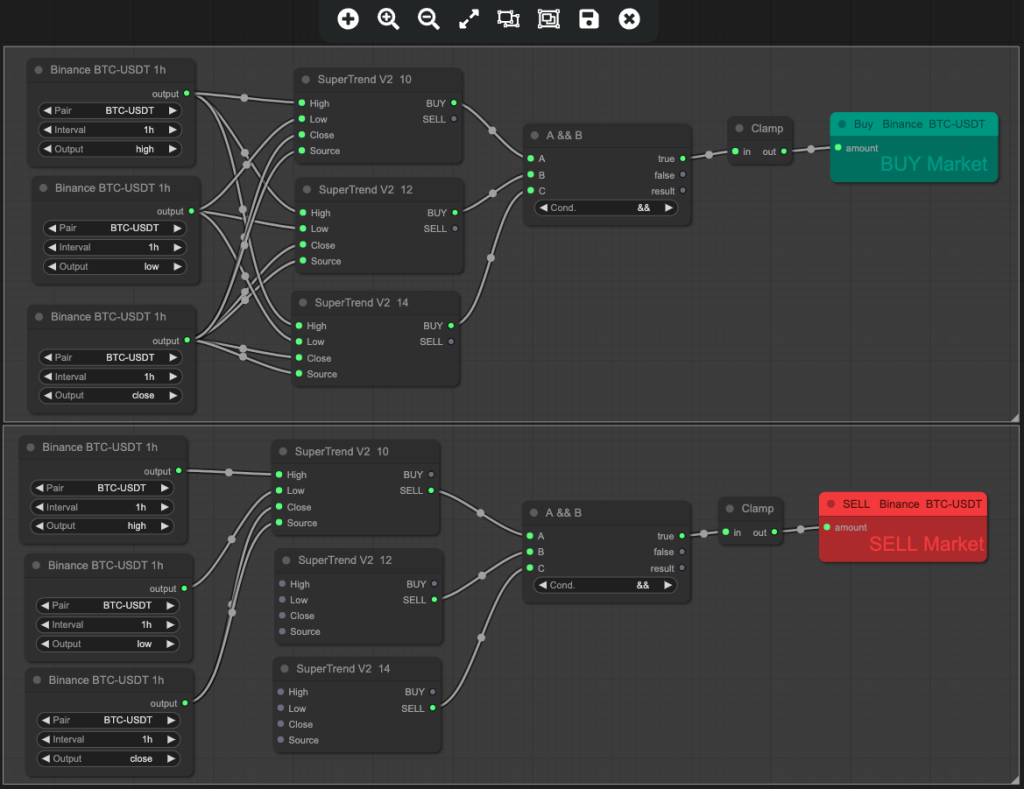
For traders seeking more robust trend confirmation and filtering out false signals, a multi-Super Trend strategy can be employed. In this approach, traders utilize multiple instances of the Super Trend indicator with varying parameters, such as different periods and multipliers, to generate more accurate buy and sell signals.
For instance, a trader may set up three Super Trend indicators with parameters as follows:
- Super Trend 1: Period 10, Multiplier 2
- Super Trend 2: Period 12, Multiplier 3
- Super Trend 3: Period 14, Multiplier 4
In this setup, each Super Trend indicator calculates its values independently based on the specified parameters. However, the buy or sell signal is triggered only when all three Super Trend indicators align in the same direction, providing a stronger confirmation of the prevailing market trend.
By requiring confirmation from multiple Super Trend indicators, this multi-Super Trend strategy helps traders filter out false signals and increases the reliability of their trading decisions. It ensures that trades are executed only when there is a clear consensus among the indicators, reducing the likelihood of entering trades based on temporary price fluctuations.
While Super Trend indicators offer valuable insights into market trends, it’s essential for traders to combine them with other types of indicators, such as oscillators or volume-based indicators, for comprehensive analysis. By incorporating multiple indicators into their trading strategies, traders can enhance their decision-making process and achieve more consistent results in various market conditions.
Conclusion
In conclusion, the Super Trend indicator emerges as a powerful tool for traders seeking to identify and capitalize on market trends. Its simplicity, effectiveness, and versatility make it a popular choice among both novice and experienced traders alike.
Throughout this guide, we’ve explored the fundamental concepts of the Super Trend indicator, including its calculation method, applications, and practical strategies for implementation. From its ability to adapt to changing market conditions to its role in generating buy and sell signals, the Super Trend indicator offers valuable insights into market dynamics.
However, it’s important to recognize that while the Super Trend indicator can provide valuable guidance, it’s not a standalone solution. Traders should complement its use with other indicators, perform thorough analysis, and exercise sound risk management practices to maximize its effectiveness.
Moreover, successful trading requires continuous learning, adaptation, and refinement of strategies. By staying informed, practicing disciplined trading habits, and leveraging the insights gained from tools like the Super Trend indicator, traders can navigate the markets with confidence and strive for long-term success.
As you embark on your trading journey, remember to remain patient, disciplined, and adaptable. Whether you’re a seasoned trader or just starting, the Super Trend indicator can serve as a valuable ally in your quest for profitable trading outcomes.
Happy trading.
Did you enjoy this? Read our articles on other indicators here:
Unveiling the Mystery Behind Simple vs Exponential vs Hull Moving Average
Master Relative Strength Index (RSI) to Unlock Profits Trading
The Power of Moving Average Convergence Divergence (MACD) in Trading
On Balance Volume (OBV): The Most Underutilised Indicator in Trading
The Best Indicator to use in Trading?