
In the vast realm of technical analysis, traders continually seek out tools and indicators to gain insights into market behaviour and potential trading opportunities. However, amid the abundance of options available, certain indicators often remain overlooked despite their significant value. One such indicator is On Balance Volume (OBV), a powerful tool for assessing market strength and identifying potential trend reversals. Despite its efficacy, OBV tends to be underutilised by many traders. This underutilisation may stem from a combination of factors, including a lack of understanding of its functionality, overshadowing by more popular indicators, and the perception of complexity. Here we delve into the world of OBV, exploring its concept, benefits, drawbacks, and practical applications in trading. Join us as we uncover the hidden potential of OBV and shed light on its role as a valuable yet often neglected trading indicator.
Understanding On Balance Volume (OBV)
On Balance Volume (OBV) is a volume-based technical indicator used in financial markets to analyse the flow of trading volume. Developed by Joseph Granville in the 1960s, OBV is designed to track the cumulative volume flow by adding or subtracting the volume of each trading period based on the price movement. Unlike other indicators that focus solely on price action, OBV incorporates volume data to provide a comprehensive view of market strength and potential trend reversals.
Understanding the Calculation
The calculation of On Balance Volume (OBV) is based on the principle that volume precedes price movements. By tracking the cumulative volume flow, OBV aims to provide insights into the strength of buying and selling pressure in the market. There are 3 stages to consider within the calculation:
- Initialisation: The OBV calculation typically begins with an initial value, which is often set to zero or the closing price of the first period. This starting point serves as the baseline for subsequent volume calculations.
- Volume Assessment: For each period, the volume is assessed based on the price movement relative to the previous period. If the closing price of the current period is higher than the previous period, the volume for that period is considered positive. Conversely, if the closing price is lower, the volume is considered negative. If the closing price remains unchanged, the volume is treated as neutral.
- Cumulative Calculation: The volume of each period is then added to or subtracted from the cumulative OBV value, depending on its polarity. If the volume is positive, it is added to the cumulative OBV value; if negative, it is subtracted.
Example
Let’s consider a hypothetical scenario where we have the following price and volume data for a particular asset:
- Day 1: Closing Price = $50, Volume = 100, OBV = 0
- Day 2: Closing Price = $55, Volume = 150, OBV = 100 (Day 1’s OBV + Day 2’s Volume)
- Day 3: Closing Price = $52, Volume = 120, OBV = 30 (Day 2’s OBV – Day 3’s Volume)
- Day 4: Closing Price = $58, Volume = 200, OBV = 230 (Day 3’s OBV + Day 4’s Volume)
Pros and Cons of OBV
Pros:
- Simple to Understand: One of the primary advantages of OBV is its simplicity. Traders of all experience levels can grasp its concept and implementation relatively quickly, making it accessible to a wide range of market participants.
- Incorporates Volume: Unlike many other technical indicators that focus solely on price movements, OBV integrates volume data, providing traders with a more comprehensive view of market activity. This inclusion of volume can offer valuable insights into the strength and direction of price trends.
- Leading Indicator: OBV is considered a leading indicator, meaning it often signals potential trend reversals or continuations before price movements occur. This predictive nature can help traders anticipate market shifts and make informed trading decisions.
Cons:
- Subject to False Signals: Like any technical indicator, OBV is not infallible and can generate false signals, particularly during periods of low volume or choppy price action. Traders should exercise caution and use OBV in conjunction with other indicators to confirm signals.
- Lack of Precision: While OBV can provide useful insights into market sentiment, it may lack the precision of more complex indicators. Traders relying solely on OBV may encounter challenges in accurately timing their entries and exits, especially in fast-moving or volatile markets.
- Limited Effectiveness in Certain Conditions: In some market conditions, such as range-bound or sideways markets, OBV may produce less reliable signals. Traders should be mindful of the prevailing market environment and adjust their trading strategies accordingly to avoid relying too heavily on OBV during these periods.
- Data Limitations: OBV’s effectiveness may be limited by the amount of data available for analysis. Many trading charts have a maximum number of trading candles in their datasets, which can restrict the historical range over which OBV calculations can be performed. However, Arrow Algo software overcomes this limitation by allowing OBV calculations to be conducted back to the origination of an asset, providing traders with a more comprehensive perspective on market dynamics.
Practical Applications of OBV
Trend Confirmation
One of the primary applications of On Balance Volume (OBV) is trend confirmation. By analysing OBV trends alongside price movements, traders can validate the prevailing trend in the market. When OBV aligns with price trends, it provides additional confirmation of the direction in which the market is moving.
Identifying Trend Reversals
OBV is also valuable for identifying potential trend reversals. When OBV diverges from price trends, it can indicate shifts in market sentiment. For instance, if the price continues to rise while OBV remains flat or declines, it suggests weakening buying interest, signalling a potential reversal in the upward trend. Conversely, if the price is falling while OBV remains stable or rises, it may indicate diminishing selling pressure, hinting at a potential bullish reversal.
Filtering Noise in Strategies
Additionally, OBV can help filter out noise in trading strategies by acting as a signal filter. Integrating OBV into a trading strategy can help traders avoid false signals and focus on high-probability trading opportunities. By incorporating OBV criteria into buy or sell signals, traders can enhance the effectiveness of their strategies and improve overall trading performance.
Examples
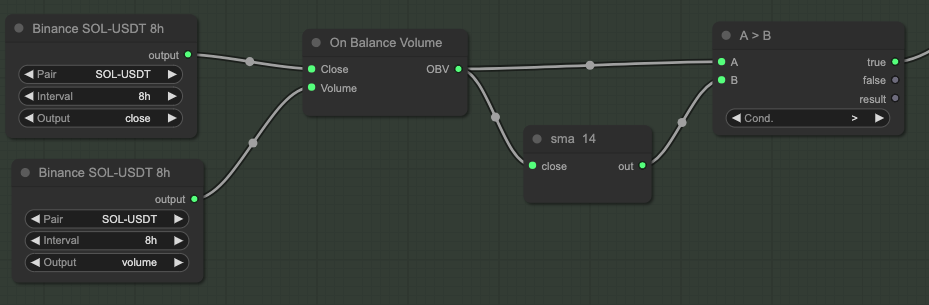
Method 1: Confirming that OBV is higher than its long term average.
Shown by the 8 hour OBV value being higher than its 14 period Simple Moving Average.
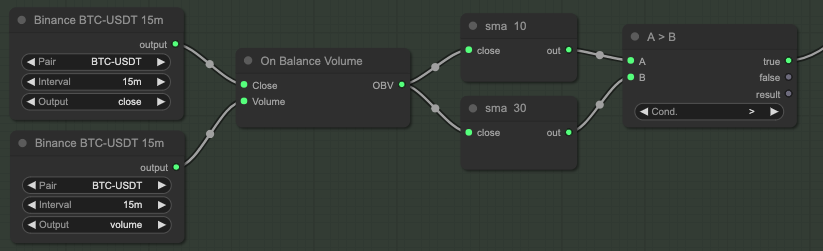
Method 2: Confirming that OBV short term average is higher than a longer term average
Shown by the 15 minute OBV 10 period Simple Moving Average being higher than the 15 minute OBV 30 period Simple Moving Average.
Both of these methods validate that the market is in a bull, or rising conditions. Filtering out false signals that may have been generated in unfavourable conditions for spot strategies.
Tips for Using OBV Effectively
Combining OBV with Other Indicators
While OBV can be a powerful standalone indicator, combining it with other types of technical indicators can further enhance its effectiveness. Traders can integrate OBV with Trend, Momentum or Volatility indicators such as moving averages, RSI (Relative Strength Index), MACD (Moving Average Convergence Divergence), or Bollinger Bands to validate signals and confirm trends. By cross-referencing OBV with complementary indicators, traders can strengthen their trading decisions and improve the accuracy of their analyses. For a detailed guide on the best ways to combine different types of indicators, read our blog post on the subject.
Adjusting Parameters for Optimal Results
To maximise the effectiveness of OBV, traders can experiment with different parameters to suit their trading style and preferences. This includes adjusting the look-back period for OBV calculations, fine-tuning the sensitivity of OBV signals, or customising threshold levels for trade entry and exit. By optimising OBV parameters based on market conditions and trading objectives, traders can tailor their strategies for optimal performance and adaptability.
By following these tips, traders can harness the full potential of OBV as a versatile and reliable tool for technical analysis. With strategic integration and parameter adjustments, OBV can provide valuable insights into market trends, momentum shifts, and potential trading opportunities, empowering traders to make informed decisions and achieve consistent results in their trading endeavors.
Conclusion
On Balance Volume (OBV) stands as a formidable yet often overlooked tool in the realm of technical analysis. Despite its simplicity and potential for providing valuable insights into market dynamics, OBV remains underutilised by many traders. This neglect may stem from a lack of understanding, overshadowing by more popular indicators, or misconceptions regarding its complexity.
However, as we’ve explored in this article, OBV offers several advantages that traders can leverage to enhance their trading strategies. From its straightforward calculation method to its incorporation of volume data, OBV provides a comprehensive view of market strength and potential trend reversals. Additionally, its status as a leading indicator enables traders to anticipate market shifts and make informed trading decisions.
While OBV is not without its limitations, such as susceptibility to false signals and potential data constraints, its practical applications in trend confirmation, identifying trend reversals, and filtering noise in strategies make it a valuable asset for traders. By combining OBV with other indicators and adjusting parameters for optimal results, traders can unlock the full potential of this powerful tool and improve their overall trading performance.
In essence, by embracing the hidden potential of OBV and integrating it into their trading arsenal, traders can gain a competitive edge in the markets and achieve consistent results in their trading endeavors. As with any trading tool, thorough understanding, experimentation, and adaptation are key to harnessing the true power of OBV and maximizing its benefits.
Did you enjoy this?
Read some of our other articles on other indicators:
Unveiling the Mystery Behind Simple vs Exponential vs Hull Moving Average
Master Relative Strength Index (RSI) to Unlock Profits Trading
The Power of Moving Average Convergence Divergence (MACD) in Trading
What is the Super Trend Indicator? How can you make profit with it?
Leave a Reply