
Acceleration Bands (AB): Complete Guide for Algorithmic Trading
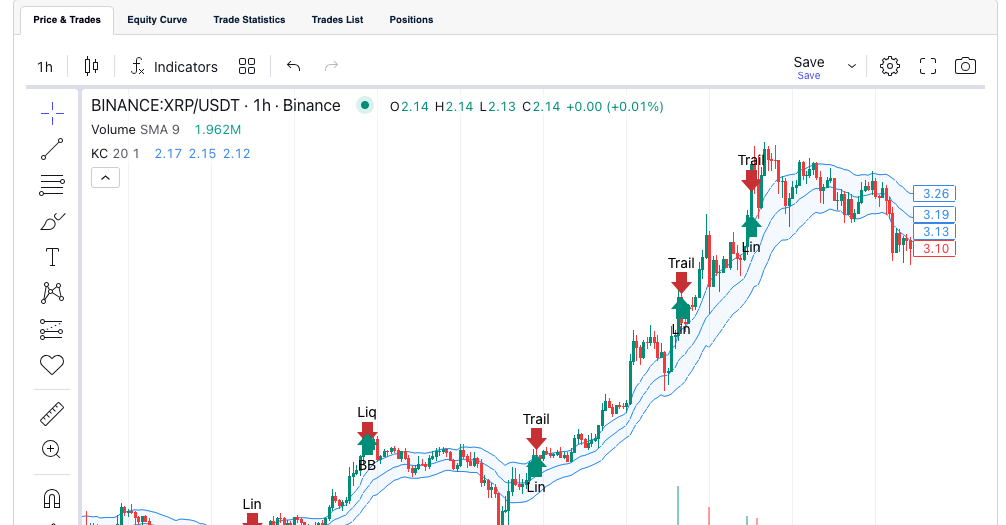
Acceleration Bands — or AB — are a volatility and momentum indicator built around a simple moving average, with upper and lower bands that widen based on the asset’s own price range rather than standard deviation. Where Bollinger Bands use statistical dispersion and Keltner Channels use Average True Range, Acceleration Bands derive their width from the relationship between an asset’s daily high-low range and its midpoint price. The result is a set of bands that expand naturally when the market is moving with conviction and contract when it is not.
What Are Acceleration Bands?
Acceleration Bands are a channel indicator developed by Price Headley. They consist of three lines: an upper band, a middle band (a simple moving average), and a lower band. The upper and lower bands are constructed by applying a multiplier to the SMA — a multiplier derived from the asset’s own price action rather than from a fixed statistical measure.
The core idea is that price closing outside the bands signals strong directional momentum — the kind of move that is more likely to continue than to reverse immediately. The indicator is particularly useful for breakout identification and trend confirmation in systematic strategies.
How Are Acceleration Bands Constructed?
The calculation uses three components for each period:
- Middle band: A simple moving average of the closing price over N periods (typically 20)
- Upper band: Middle band multiplied by (1 plus 4 times the ratio of the period’s high-low range to its high-low sum)
- Lower band: Middle band multiplied by (1 minus the same ratio)
The key is the ratio at the heart of the calculation. It measures how large the period’s high-low range is relative to the midpoint of that range. On a day where price moves a lot relative to its level, the ratio is high and the bands widen sharply. On a quiet day, the ratio is small and the bands sit close together.
This means Acceleration Bands naturally react to each asset’s own volatility profile. An asset that trades with large daily ranges will have wider bands than a low-volatility asset at the same price level — without needing any manual parameter adjustment. In Arrow Algo, the AB block handles this calculation automatically. You set the period and the output connects directly to your strategy logic.
How to Interpret Acceleration Bands Signals
The primary signal generated by Acceleration Bands is a close outside the upper or lower band.
- Close above the upper band: Price has moved with enough conviction to break through the volatility threshold. This signals strong upward momentum and a potential breakout worth following.
- Close below the lower band: Price has broken through to the downside with conviction. This signals strong bearish momentum and a potential breakdown.
- Price within the bands: The market is consolidating or ranging. Momentum strategies should stand aside. Mean reversion setups become more relevant in this zone.
- Bands contracting: Volatility is compressing. The market is coiling. A significant move may be approaching — similar to the Bollinger Squeeze concept.
Volume context matters here. A close outside the bands on above-average volume is a more reliable signal than one on thin volume. Always assess the breakout in the context of broader market conditions. According to Investopedia’s guide to Acceleration Bands, the indicator works best when applied on daily timeframes with a standard 20-period setting.
What Are the Best Acceleration Bands Trading Strategies?
1. Momentum Breakout
Wait for a daily close outside the upper band (for longs) or lower band (for shorts). Use a volume confirmation — require volume to be above its N-period average on the breakout candle. Enter on the following open and hold the position until price closes back inside the bands. This keeps you in strong trending moves without over-optimising the entry timing.
2. Acceleration Filter for Entry Signals
Use the AB position as a filter for other momentum signals. Only allow long entries when price is above the upper band — confirming the strategy is operating in a strong uptrend regime. Reject signals when price is within the bands, as the momentum environment is neutral. This reduces the number of trades while improving quality.
3. Band Reversion After Overextension
When price has been trading above the upper band for multiple consecutive periods, a return back inside the bands can signal trend exhaustion. Combine with an overbought RSI reading to look for mean-reversion entries as the move unwinds. This approach runs counter to the primary breakout use case, so it requires additional confirmation.
What Mistakes Do Traders Make with Acceleration Bands?
- Treating a break as guaranteed continuation: A close outside the bands signals strong momentum, not a certain trend. Always use a confirmation rule before entering — a follow-through candle or volume check reduces false starts.
- Using AB in isolation: Acceleration Bands identify momentum conditions. They do not define trend direction. Pair them with a trend indicator such as an EMA to ensure you are trading in the direction of the prevailing move.
- Applying fixed thresholds for “outside the band”: The signal is a close outside, not a touch. Intrabar moves outside the band that close back inside are noise — wait for the confirmed close.
- Ignoring the contraction phase: Contracted bands signal an upcoming move but not its direction. Entering before the breakout is confirmed increases the risk of being on the wrong side of the move.
How to Build Acceleration Bands Strategies in Arrow Algo
Arrow Algo includes an AB block in its visual builder. Drag it onto the canvas, set your lookback period, and connect the upper and lower band outputs to your entry and exit logic. No coding required.
A basic momentum breakout setup on the canvas looks like this:
- Add an AB block — period 20
- Add a Crossover block — triggers when the closing price crosses above the upper band output
- Add a Volume block and a condition block — requires volume above its 20-period average to confirm the breakout
- Connect both conditions to an AND gate
- Add a second Crossover block — triggers when price crosses back below the upper band as the exit signal
- Connect all blocks to your order blocks with your chosen position size
For a trend-filter version, add an EMA block and require price to be above the EMA before any long entry fires. This eliminates counter-trend signals in downtrending conditions. For more on combining momentum signals with trend context, see our post on mean reversion vs trend following strategies.
What Are the Key Takeaways?
- Acceleration Bands use a price-range-based multiplier rather than standard deviation — they adapt to each asset’s own volatility profile
- A close outside the upper or lower band signals strong directional momentum and a potential breakout
- Price within the bands indicates a ranging environment — momentum strategies should stand aside
- Contracting bands signal a coiling market — watch for a directional break rather than entering prematurely
- Always pair AB with a volume confirmation and trend context — the bands show momentum conditions, not guaranteed direction
- In Arrow Algo, the AB block connects directly to crossover and condition blocks — build breakout strategies visually with no code required
Disclaimer: This content is for educational purposes only and does not constitute financial advice. Trading involves significant risk and you should only trade with capital you can afford to lose. Past performance is not indicative of future results. Always conduct your own research before making any trading decisions.
Ready to build your own automated trading strategies without writing a single line of code? Start for free at Arrow Algo and join thousands of traders who’ve made the switch to systematic trading.