
ADX Trend Strength Strategy: How to Build It in Arrow Algo
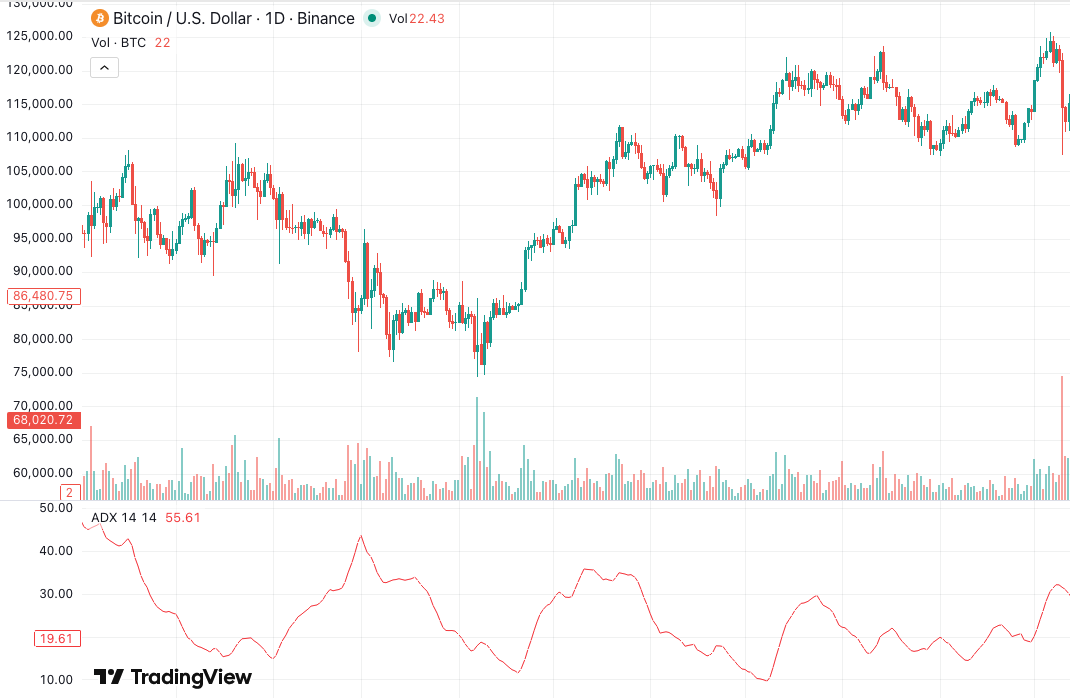
An ADX trend strength strategy uses the Average Directional Index to answer one question before every trade: is this market actually trending? Most trend-following losses don’t come from bad entries. They come from good entries taken in markets with no trend to follow. The ADX fixes that by measuring trend strength — not direction — and filtering out the chop.
What Is an ADX Trend Strength Strategy?
The Average Directional Index (ADX) was developed by J. Welles Wilder, the same engineer behind the RSI and ATR. It outputs a single line between 0 and 100. Higher readings mean a stronger trend. Lower readings mean a weak or absent trend.
Crucially, the ADX says nothing about direction. A reading of 40 could mean a powerful uptrend or a powerful downtrend. That makes it a poor entry signal on its own — and an excellent filter. An ADX trend strength strategy pairs the ADX with a directional signal, such as a moving average crossover, and only takes trades when the ADX confirms the market is trending.
How Does the ADX Measure Trend Strength?
The calculation starts with two companion lines: DI+ and DI-. DI+ measures upward price pressure. DI- measures downward pressure. Each compares today’s highs and lows against yesterday’s, then smooths the result over a period — typically 14 bars.
The ADX then measures the gap between DI+ and DI-. When one side dominates, the gap is wide and the ADX rises. When buyers and sellers are balanced, the gap narrows and the ADX falls. The final value is smoothed again, which is why the ADX reacts slowly. That lag is a feature, not a flaw — it keeps the filter from flipping on every noisy bar.
Reading ADX Levels: 20, 25, and 40 Explained
Traders generally use three zones, as outlined in Investopedia’s ADX overview:
- Below 20: no meaningful trend. Crossover signals in this zone are mostly noise.
- 20–25: a trend may be emerging. Some traders treat a rising ADX crossing 20 as an early signal.
- Above 25: a confirmed trend. This is the classic threshold for enabling trend-following entries.
- Above 40: a very strong trend — but often a mature one. Late entries here carry elevated reversal risk.
The slope matters as much as the level. A rising ADX at 22 is often more useful than a falling ADX at 30. A falling ADX from a high level warns that the trend is losing fuel, even before price confirms it.
Three Ways to Trade the ADX Trend Strength Strategy
The ADX is a filter, so it slots into almost any directional system. Three proven combinations:
1. Trend filter for crossovers. Take a moving average crossover entry only when the ADX is above 25. This single condition removes the whipsaw trades that bleed crossover systems dry in ranging markets. Exits stay unchanged.
2. Rising-ADX breakout confirmation. Combine a price breakout — say, a 20-bar high — with an ADX that is both above 20 and rising. The rising slope confirms fresh momentum behind the breakout rather than a fake-out in dead water.
3. Low-ADX regime switch. Flip the logic. When the ADX is below 20, disable trend entries and enable a mean-reversion system instead. Ranging markets punish trend followers but reward fading extremes. One indicator, two regimes, zero guesswork.
Which Mistakes Undermine ADX Strategies?
Four errors show up constantly in backtests:
- Trading the ADX as a direction signal. A rising ADX in a downtrend means the downtrend is strengthening. Always pair it with a directional component such as DI+/DI- or price structure.
- Entering on extreme readings. An ADX above 45 often marks trend exhaustion, not opportunity. The strongest reading frequently prints near the end of the move.
- Ignoring the lag. The double smoothing means the ADX confirms trends late. Expect to miss the first leg — that is the cost of the filter.
- One threshold for every market. Crypto pairs trend differently from FX or indices. Backtest thresholds between 20 and 30 per asset rather than copying 25 blindly.
Building the ADX Trend Strength Strategy in Arrow Algo
Arrow Algo’s no-code visual builder makes this a three-block job. Drag an ADX block onto the canvas and set the period — 14 is the standard starting point. Add your directional signal, such as an EMA crossover. Then connect both through a condition block so an entry only fires when the crossover triggers and the ADX reads above your threshold.
Want the regime-switch version? Add a second branch that routes to mean-reversion logic when the ADX sits below 20. Everything is drag-and-drop — no programming required. Backtest the filtered and unfiltered versions side by side on live exchange data from Binance, Coinbase or HyperLiquid, and compare the trade count and drawdown. New to the indicator itself? Start with our full ADX guide for algorithmic trading.
What Should You Remember?
- The ADX measures trend strength, never direction — use it as a filter, not an entry signal
- Above 25 confirms a trend; below 20 signals chop; above 40 warns of maturity
- The ADX slope often matters more than its absolute level
- Pair it with crossovers, breakouts, or use low readings to switch into mean reversion
- Backtest your threshold per asset — 25 is a starting point, not a law
Disclaimer: This content is for educational purposes only and does not constitute financial advice. Trading involves significant risk and you should only trade with capital you can afford to lose. Past performance is not indicative of future results. Always conduct your own research before making any trading decisions.
Ready to build your own automated trading strategies without writing a single line of code? Start for free at Arrow Algo and join thousands of traders who’ve made the switch to systematic trading.