
Bollinger Band Breakout Strategy: How to Build It in Arrow Algo
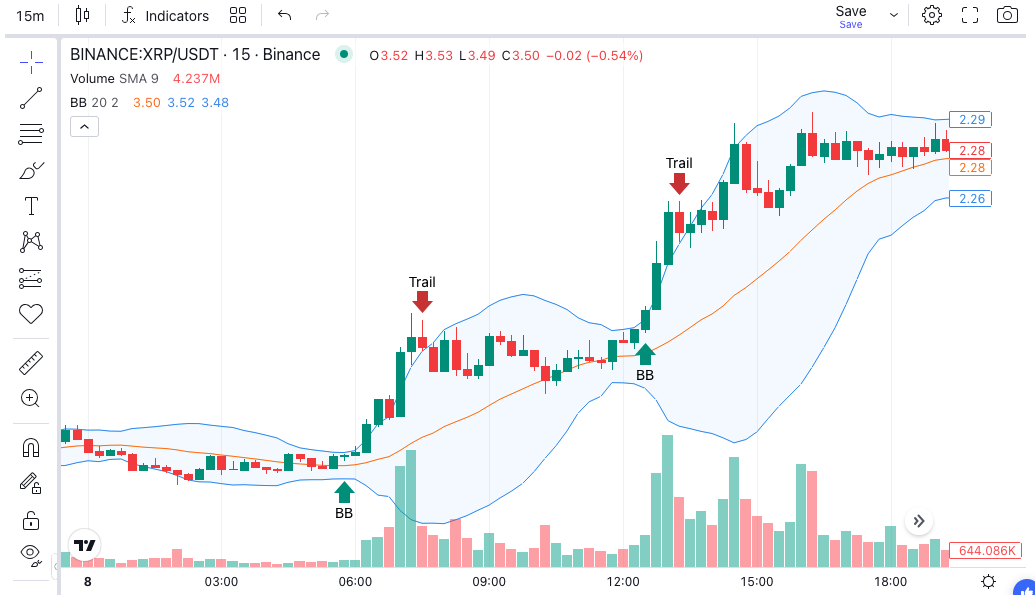
The Bollinger Band Breakout strategy uses price movement beyond the outer bands as a direct entry signal — treating a close outside the bands as evidence that momentum is strong enough to sustain a directional move. Unlike the squeeze setup, which waits for a volatility compression before acting, the breakout approach works across varying volatility conditions and focuses on the band penetration itself as the trigger.
What Makes Bollinger Bands a Breakout Tool?
Bollinger Bands are a volatility-adaptive indicator. The upper and lower bands expand and contract with price volatility, sitting a fixed number of standard deviations away from a central moving average. By design, roughly 95% of price action falls inside the bands when using the standard two standard deviation setting. A close outside the bands is statistically uncommon — and that rarity is what makes it a useful signal.
When price closes above the upper band, it means the move was large enough relative to recent volatility to push price into a region that only 5% of candles reach. That is not automatically a reason to enter, but it tells you momentum is elevated. The breakout strategy’s job is to filter which of those closes represent genuine directional momentum versus temporary spikes that quickly reverse.
How Does a Bollinger Band Breakout Signal Form?
The standard setup uses the default 20-period moving average with 2 standard deviation bands. A long signal forms when a candle closes above the upper band. A short signal forms when a candle closes below the lower band.
The middle band — the 20-period moving average — acts as both a dynamic trend reference and a natural exit level. Many implementations exit a long position when price closes back below the middle band, and exit a short when price closes above it. This keeps holding periods aligned with the momentum that triggered the entry.
You can also adjust the standard deviation multiplier to change signal frequency. A tighter 1.5 standard deviation setting generates more signals. A wider 2.5 standard deviation setting generates fewer, higher-conviction signals. Arrow Algo’s BBands block exposes both the period and the deviation multiplier as editable properties — you can test multiple settings through the backtester without rebuilding the strategy.
Two Ways to Trade a Bollinger Band Breakout
Continuation: Trade With the Breakout
Enter in the direction of the close. A close above the upper band triggers a long. A close below the lower band triggers a short. This treats the breakout as the start of an extended move and aims to ride momentum while it persists. It works best in trending markets where price continues in the breakout direction after leaving the band.
Reversion: Fade the Extreme
Enter against the direction of the close. A close above the upper band triggers a short entry on the assumption the move has overextended. A close below the lower band triggers a long, expecting a snap-back toward the middle band. This works best in ranging, choppy markets where band touches mark short-term extremes rather than continuation signals.
The two approaches require very different filters and work in opposite market regimes. Deciding which to use comes down to the broader trend context. An ADX reading above 25 suggests a trending environment — the continuation approach fits better. ADX below 20 suggests a ranging environment — the reversion approach becomes more viable. Arrow Algo lets you wire an ADX block as a regime gate to automatically select between the two modes. For more on this, see our post on market regime detection in algo trading.
Filtering Out False Breakouts
Band touches that fail quickly — where price closes outside the band and immediately reverses — are the primary risk in any breakout strategy. Three filters reduce the false positive rate significantly:
Volume confirmation: Require above-average volume on the breakout candle. Genuine breakouts are typically accompanied by elevated participation. A breakout on low volume is more likely to fail. The OBV or volume sum block in Arrow Algo can provide a volume threshold check.
ATR-scaled distance: Require price to have moved at least one ATR beyond the band before triggering entry. This eliminates candles that barely clip the outer band and immediately pull back. It adds a minimum momentum threshold to the signal. Read more about ATR in the ATR complete guide.
Trend alignment: Only take long breakouts when price is above the 50-period or 200-period moving average. Only take short breakouts when price is below it. This aligns the trade with the dominant trend direction and rejects counter-trend breakouts, which fail at a higher rate.
Mistakes That Erode Bollinger Band Breakout Returns
Ignoring regime: The continuation approach in a ranging market produces a sequence of losing trades as breakouts reverse. Always know whether the market is trending or ranging before choosing which mode to apply.
Entering on wicks, not closes: Price that momentarily wicks outside the band but closes back inside is not a confirmed breakout. Always base entries on confirmed candle closes — not mid-candle price crosses — to avoid noise-driven entries.
No exit plan for the middle band: Many traders enter on the breakout but have no defined exit rule. Without one, they hold through the full mean-reversion back to the middle band and give up all the gains. Define your exit at the time you define your entry.
Using the same parameters across all markets: The default 20-period, 2 standard deviation setting was developed for equities. Crypto markets have different volatility characteristics. Test the parameter settings on each specific pair and timeframe you plan to trade — do not assume the default produces the best results.
Over-filtering to the point of too few signals: Adding volume, ATR, and trend filters is sensible, but stacking too many conditions leaves you with so few trades that the backtest result is not statistically meaningful. Aim for at least 30–50 trades in a backtest to assess strategy robustness.
Building a Bollinger Band Breakout Strategy in Arrow Algo
Here is how to assemble a trend-following band breakout strategy using Arrow Algo’s visual block builder:
- BBands block: Place a Bollinger Bands block. Set the period and deviation multiplier. This outputs the upper band, middle band, and lower band.
- Crossover block: Use a Crossover block to detect price closing above the upper band (long signal) or below the lower band (short signal). Connect the close price and the upper/lower band outputs.
- Moving average block: Add an EMA or SMA block (50 or 200 period). Use a condition block to check whether price is above (long filter) or below (short filter) this level.
- AND condition block: Combine the crossover signal and the trend filter using an AND condition block. This is your final entry signal.
- Exit rule: Add a second crossover block monitoring price vs the middle band. When price crosses back through the middle band, trigger the exit.
- Stop-loss: Use a TrailingStop block or a fixed ATR-based stop below the entry candle to cap the downside on failed breakouts.
Once built, run a backtest on your target pair and timeframe. Compare the continuation version against the reversion version across different market periods to understand which regime each performs in. That context helps you decide when to run each version live.
Key Takeaways
- The Bollinger Band Breakout strategy triggers entries when price closes outside the upper or lower band
- Two modes exist: continuation (trade with the breakout) and reversion (fade the extreme) — they work in opposite market regimes
- ADX can serve as a regime gate: high ADX favours continuation, low ADX favours reversion
- Volume confirmation, ATR-scaled distance, and trend alignment are the three most effective false-breakout filters
- Always base entries on confirmed candle closes, not mid-candle wick penetrations
- The middle band makes a natural exit level — define it before you enter, not after
- Test parameter settings on each specific pair and timeframe; the default 20/2 setting is a starting point, not a universal optimum
- Arrow Algo’s visual block builder lets you combine BBands, Crossover, EMA, and condition blocks to build and backtest the full strategy without code
Disclaimer: This content is for educational purposes only and does not constitute financial advice. Trading involves significant risk and you should only trade with capital you can afford to lose. Past performance is not indicative of future results. Always conduct your own research before making any trading decisions.
Ready to build your own automated trading strategies without writing a single line of code? Start for free at Arrow Algo and join thousands of traders who’ve made the switch to systematic trading.