
Bollinger Band Mean Reversion Strategy: How to Build It in Arrow Algo
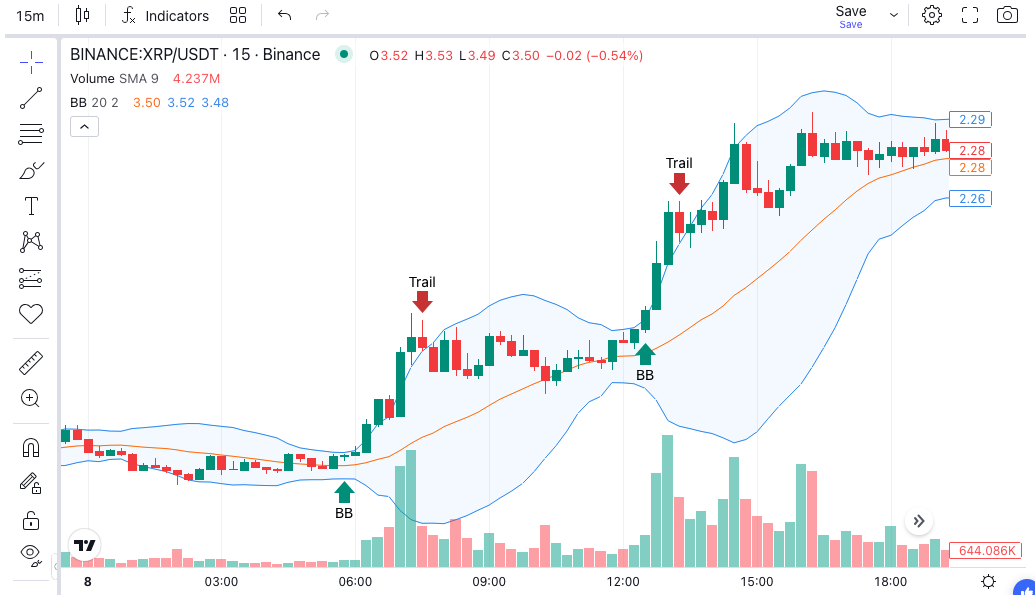
The Bollinger Band mean reversion strategy trades the assumption that price returns to its average after stretching too far in one direction. Where a breakout strategy bets on price continuing beyond the bands, mean reversion does the opposite — it enters when price touches an extreme and fades the move back toward the middle band.
This approach works because markets spend more time ranging than trending. When price compresses and then stretches to an extreme, the statistical tendency is to snap back — not continue indefinitely in the same direction.
What Is a Bollinger Band Mean Reversion Strategy?
A Bollinger Band mean reversion strategy is a systematic approach that identifies when price has moved to an abnormal extreme relative to its recent average, then enters a trade expecting a return toward the mean.
The Bollinger Bands indicator places a middle band (a 20-period simple moving average) flanked by two outer bands set at a multiple of standard deviation above and below. Price touching the lower band signals an oversold extreme. Price touching the upper band signals an overbought extreme. The middle band is the target. The trade thesis: price stretched too far, the pressure will release, and price will return.
How Does Bollinger Band Mean Reversion Work?
Standard deviation measures how spread out prices are from the average over the lookback period. When price moves two standard deviations from the 20-period mean, it occupies a statistically unusual zone. Roughly 95% of prices fall within the bands under normal distribution assumptions.
This does not mean price always reverts. In a strong trend, price can walk the bands — touching the upper band candle after candle as momentum carries it higher. Mean reversion entries without a regime filter will produce repeated losses in these conditions. The directional environment matters more than the signal itself.
Which Signals Tell You the Reversion Is Starting?
Band touch with RSI confirmation
Price closes at or below the lower band while RSI is simultaneously below 30. Both conditions must be true at the same time. The RSI filter removes situations where price is at the band but momentum has not yet reached an oversold extreme.
Candle rejection at the band
Price wicks below the lower band but closes back above it on the same candle. The wick shows rejection: sellers pushed price to the extreme but buyers absorbed the move and pulled it back. This candle pattern is the visual equivalent of a bounce signal and strengthens the entry case.
%B crossover
The %B indicator measures where price sits relative to the bands on a 0-to-1 scale. A reading below 0 means price is below the lower band. Entering when %B crosses back above 0 gives a cleaner, slightly later entry with a higher probability of confirmation already in place.
What Are the Best Mean Reversion Setups?
Lower band bounce with RSI filter
Price touches the lower band while RSI is below 30. Enter long. Target the middle band. Stop below the recent swing low. This is the simplest version and performs well in ranging conditions with a regime filter applied.
Upper band rejection short
Price touches the upper band while RSI is above 70. Enter short. Target the middle band. Stop above the recent swing high. The mirror of the long setup — equally valid, and accessible to systematic traders via crypto perpetual contracts.
Regime-filtered mean reversion
Add ADX as a gate: only take mean reversion entries when ADX is below 25, confirming the market is ranging rather than trending. This single addition dramatically reduces losing trades caused by walking the bands in a strong directional move. For the opposite approach in trending conditions, see the Bollinger Band breakout strategy.
What Mistakes Undermine This Strategy?
Trading mean reversion in a trending market
In a strong uptrend, price repeatedly touches the upper band and continues higher. Every short entry loses. Mean reversion without an ADX filter will produce a string of losses in these conditions. ADX below 25 is the most reliable gate to prevent this.
Targeting the opposite band instead of the middle
When price touches the lower band, the high-probability target is the middle band — not the upper band. Stretching the target requires two full standard deviation moves in your favour. It happens, but not frequently enough to build a strategy around. Take the middle band, reset, re-enter if conditions fire again.
Setting stops too tight
Mean reversion entries happen at extremes. Price often makes a brief further push before reversing. A stop placed just below the band close gets hit regularly by normal noise. ATR-based stops positioned below the swing extreme — not the close — give the trade room to work.
Ignoring band width context
Very wide bands indicate already-elevated volatility. A lower band touch in a wide-band environment carries more continuation risk than one in a compressed, quiet market. Filtering for entries when band width is at or below its recent average reduces exposure to high-volatility outlier moves.
How to Build a Bollinger Band Mean Reversion Strategy in Arrow Algo
Arrow Algo’s visual block builder lets you assemble this logic by dragging and connecting blocks — no code required:
- Add a BBands block — set period to 20 and standard deviation multiplier to 2. Outputs: upper band, middle band, lower band
- Add an RSI block — period 14. Connect to a comparison block checking RSI < 30
- Add a price comparison block — check whether the close is at or below the lower band value
- Connect both to an AND gate — lower band touch and RSI below 30 must both be true
- Add an ADX block — period 14. Add a comparison checking ADX < 25. Connect as a third input to the AND gate
- Set the entry block — fires long when all three conditions are met
- Set the exit block — exit when price closes above the middle band
- Add an ATR stop-loss block — place the stop 1.5× ATR below the swing low at entry
Run a backtest across both ranging and trending periods. Compare results with and without the ADX filter — the improvement will be visible immediately in the drawdown and win rate figures.
Key Takeaways
- The Bollinger Band mean reversion strategy fades price moves to the band extremes, targeting a return to the middle band
- It works best in ranging markets — add an ADX < 25 filter to prevent entries during trending conditions
- Combine a lower band touch with RSI below 30 for higher-probability entries
- Target the middle band, not the opposite band — one standard deviation move in your favour is the realistic expectation
- Use ATR-based stops below the swing extreme to avoid being stopped out by normal volatility
- Arrow Algo’s visual block builder lets you build and backtest this strategy without writing any code
Disclaimer: This content is for educational purposes only and does not constitute financial advice. Trading involves significant risk and you should only trade with capital you can afford to lose. Past performance is not indicative of future results. Always conduct your own research before making any trading decisions.
Ready to build your own automated trading strategies without writing a single line of code? Start for free at Arrow Algo and join thousands of traders who’ve made the switch to systematic trading.