
Bollinger Band Squeeze Strategy: How to Build It in Arrow Algo
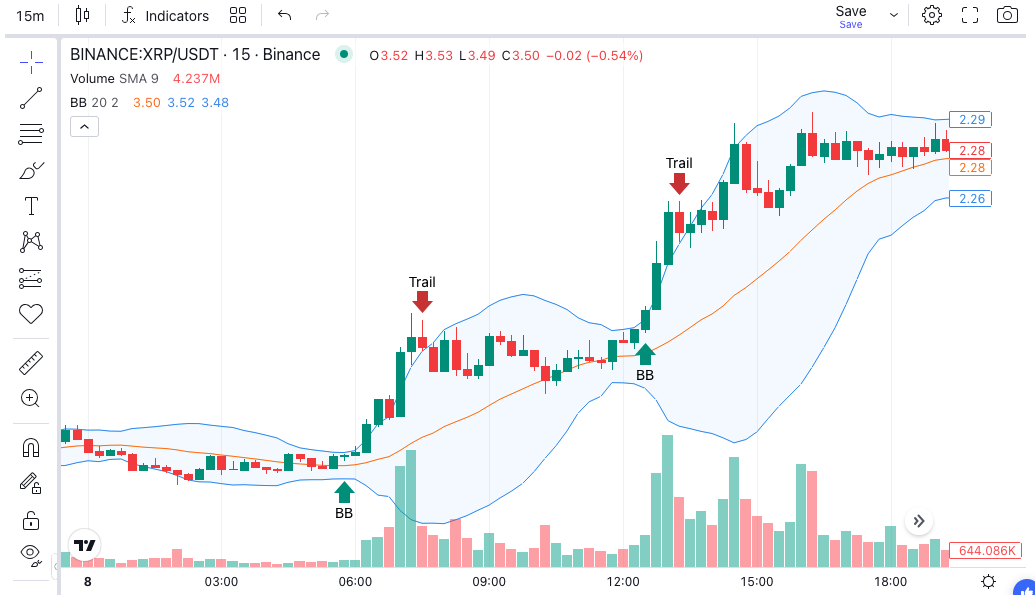
The Bollinger Band Squeeze strategy is one of the most practical approaches to timing breakouts systematically — built on the observation that low-volatility periods tend to precede sharp directional moves. Detecting when Bollinger Bands are unusually tight gives algorithmic traders a repeatable setup for anticipating the expansion phase before it fully develops.
What Is the Bollinger Band Squeeze?
Bollinger Bands are a volatility indicator developed by John Bollinger. They consist of three lines: a middle band (a 20-period simple moving average by default), an upper band, and a lower band. The upper and lower bands are positioned a fixed number of standard deviations from the middle band. When price volatility increases, the bands widen. When volatility contracts, the bands narrow.
A Bollinger Band Squeeze occurs when the upper and lower bands contract to an unusually tight range. This compression reflects a period of low price volatility. The logic behind the squeeze strategy is straightforward: volatility is mean-reverting. Extended periods of calm tend to precede sharp moves. The squeeze is a coiled spring — and the strategy is built to trade the release.
The squeeze alone does not indicate direction. It signals that a significant move is approaching. Additional confirmation signals are required to determine whether the breakout will be to the upside or the downside.
How Does Bollinger Band Width Detect a Squeeze?
The core measurement is Bollinger Band Width (BBW). This is calculated as:
(Upper Band − Lower Band) ÷ Middle Band
When BBW drops to a multi-period low relative to its historical range, the bands are narrower than usual — a squeeze is in progress. A common approach is to compare the current BBW to its lowest value over the past 125 or 250 candles. When the current reading matches that minimum, the squeeze condition is active.
Some traders also use the Keltner Channel as a reference. When the Bollinger Bands contract inside the Keltner Channels, a squeeze is confirmed. When the Bollinger Bands expand back outside the Keltner Channels, the squeeze has fired and the breakout phase has begun. Arrow Algo includes both indicators as drag-and-drop blocks.
You do not need to perform this calculation manually. The BBW indicator block in Arrow Algo outputs the band width value directly. A Min block applied to the BBW output over a chosen lookback period identifies squeeze conditions automatically — no code required.
How to Read Bollinger Band Squeeze Signals
A squeeze setup progresses through three phases:
- Compression phase: BBW falls to a relative low. Price coils in a narrow range. Volume often declines during this phase as indecision builds.
- Trigger phase: Price begins to push against one of the outer bands. Momentum indicators start to build directionally. A candle closes outside the band with conviction.
- Expansion phase: The bands widen rapidly. Price accelerates in the breakout direction. Volume increases, confirming the move.
Entry is typically taken at the start of the trigger phase — not after the expansion is already underway. Entering mid-expansion means chasing a move that has already extended significantly from the squeeze low.
For long entries: look for price closing above the upper Bollinger Band after a confirmed squeeze, with a momentum confirmation such as RSI crossing above 50 or the MACD histogram turning positive.
For short entries: look for price closing below the lower Bollinger Band after a confirmed squeeze, with momentum confirming downside pressure.
What Are the Best Bollinger Band Squeeze Trading Strategies?
Pure Band Breakout
Enter when price closes outside the bands after a squeeze. Use the opposite band as a stop-loss reference. This is the simplest implementation. It works best in trending markets where breakouts follow through with momentum.
Momentum-Confirmed Squeeze
Add a momentum filter — requiring RSI to cross above 50 for long entries or below 50 for short entries. This reduces false signals in ranging conditions where price briefly exits the band before reversing.
Volume-Confirmed Breakout
Require above-average volume on the breakout candle. Low-volume breakouts fail more frequently. A volume confirmation filter removes fakeouts where price pokes briefly outside the band without sustained follow-through.
All three approaches can be built entirely with visual blocks in Arrow Algo. The BBW block handles squeeze detection, the BBands block provides the outer band reference levels, and RSI or MACD blocks add the momentum layer.
Common Mistakes in Bollinger Band Squeeze Trading
Entering during the squeeze, not after: The squeeze signals that volatility will expand — it does not signal when. Entering early ties up capital through potentially extended compression periods with no clean exit.
Skipping direction confirmation: A breakout from a squeeze can go either way. Without a directional filter, you are effectively taking a 50/50 trade. Always add a momentum or trend bias signal before committing to a direction.
Setting stops too tight inside the bands: During the compression phase, price action is choppy within the narrowing range. A stop placed inside the bands will frequently be hit before the real breakout begins. Place stops beyond the opposite band or at a recent swing level.
Treating all squeezes as equal: A squeeze on a 15-minute chart in a sideways market differs significantly from a squeeze on the daily chart following months of consolidation. Longer timeframes and longer squeeze durations tend to produce more powerful expansions.
Over-optimising the compression threshold: Fitting the squeeze detection period specifically to maximise backtest performance leads to overfitting. Start with standard parameters (20-period bands, BBW minimum over 125 candles) before making any adjustments.
How to Build a Bollinger Band Squeeze Strategy in Arrow Algo
Arrow Algo’s visual block builder lets you implement a full Bollinger Band Squeeze strategy without writing a single line of code. Here is the basic setup:
- BBW block: Add a Bollinger Band Width block. This outputs the current band width as a proportion of price.
- Min block: Apply a Min block to the BBW output with a 125-candle lookback. When current BBW equals the Min value, a squeeze is active.
- BBands block: Add a Bollinger Bands block. Connect the upper and lower band output slots.
- Crossover block: Use a crossover block to detect price closing above the upper band (long) or below the lower band (short).
- RSI block: Add RSI and create a condition requiring RSI above 50 as an AND condition for long entries.
- AND condition block: Combine the squeeze condition, the breakout signal, and the momentum filter using an AND condition block to form the final entry signal.
Once assembled, run the strategy through Arrow Algo’s backtester to evaluate historical performance on your chosen pair and timeframe. You can also test each component in isolation — squeeze detection alone, breakout alone — before combining them, which helps you understand exactly which part of the setup is generating the edge.
For more context on Bollinger Bands as a foundation, see the complete Bollinger Bands guide. For volatility-based strategy ideas that complement this approach, read our post on volatility clustering in algo trading.
What Are the Key Takeaways?
- The Bollinger Band Squeeze strategy identifies volatility compression periods that tend to precede strong directional moves
- Bollinger Band Width (BBW) is the core signal — a multi-period low in BBW indicates a squeeze is in progress
- The squeeze signals timing, not direction — always pair it with a momentum or trend confirmation before entering
- Common entry triggers include price closing outside the outer band with RSI or MACD confirmation
- Stops should sit beyond the opposite band, not within the compression range
- Longer timeframes and longer squeeze durations tend to produce more powerful breakouts
- Arrow Algo’s drag-and-drop block builder lets you assemble BBW detection, breakout signals, and momentum filters without any code
- Backtest across multiple pairs and timeframes before deploying live to understand how the strategy behaves in different market conditions
Disclaimer: This content is for educational purposes only and does not constitute financial advice. Trading involves significant risk and you should only trade with capital you can afford to lose. Past performance is not indicative of future results. Always conduct your own research before making any trading decisions.
Ready to build your own automated trading strategies without writing a single line of code? Start for free at Arrow Algo and join thousands of traders who’ve made the switch to systematic trading.