
Chande Forecast Oscillator (CFO): Complete Guide for Algorithmic Trading
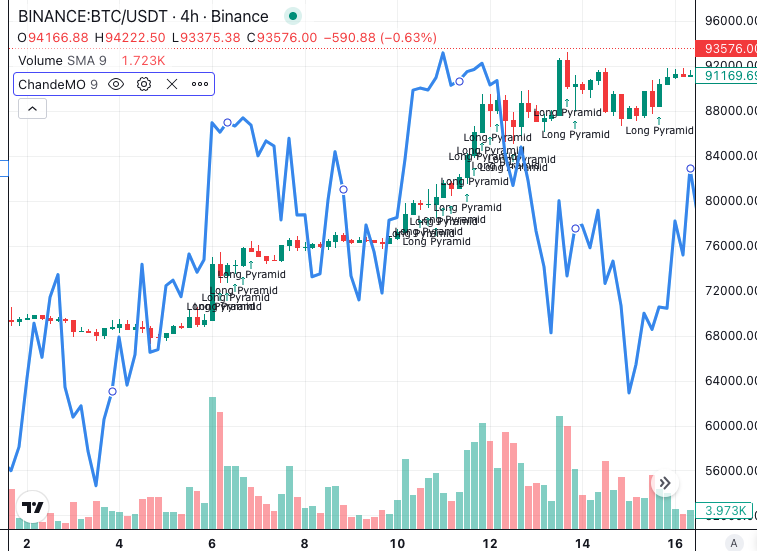
The Chande Forecast Oscillator (CFO) is a momentum indicator that measures the percentage difference between the current closing price and the linear regression value of that price over a defined lookback period. Developed by analyst Tushar Chande, CFO gives algorithmic traders a dynamic, percentage-based view of how far price has deviated from its underlying linear trend — helping identify when momentum is accelerating, stalling, or reversing.
What Is the Chande Forecast Oscillator?
CFO is a trend deviation indicator. It calculates a linear regression line through recent closing prices, then expresses the gap between the actual close and that regression value as a percentage. The result oscillates above and below zero.
When CFO is positive, price is trading above its linear trend — indicating upward momentum. When it is negative, price is below its linear trend — indicating downward pressure. The further CFO moves from zero, the greater the divergence from the underlying trend.
CFO is related to the Forecast Oscillator (FOSC) but uses a different reference point. FOSC measures deviation from the projected future value of the regression line. CFO measures deviation from the current regression value. This makes CFO a slightly more conservative measure — it tells you where price stands relative to the established trend rather than a forward projection.
How Is the Chande Forecast Oscillator Calculated?
The calculation works in three steps:
- Calculate the linear regression value: Fit a straight line through the closing prices of the last n periods. The value of that line at the current period is the regression reference.
- Find the difference: Subtract the regression value from the current closing price.
- Express as a percentage: Divide the difference by the closing price and multiply by 100. The result is CFO.
A common default lookback is 14 periods. Shorter periods produce a more reactive oscillator with more noise. Longer periods smooth the signal but lag further behind price action. The right setting depends on your trading timeframe and the asset’s typical volatility.
How to Read Chande Forecast Oscillator Signals
Zero-line crossovers: When CFO crosses from negative to positive, price has moved back above its linear regression line — a potential bullish signal. A cross from positive to negative suggests price has fallen below trend — a potential bearish signal. Crossovers work best in trending conditions. In ranging markets, they generate too many false signals to be useful on their own.
Extreme readings: Large positive values indicate price has stretched well above its regression line. This can reflect strong trending momentum, or an overextended move due for a pullback — context determines which. Large negative readings suggest price is significantly below trend. In a downtrend, these can persist. In a range, they often precede a bounce.
Divergence: When price makes a new high but CFO makes a lower high, momentum is weakening — a bearish divergence. When price makes a new low but CFO makes a higher low, selling momentum may be fading — a bullish divergence. Treat divergence as a confirmation signal rather than a standalone trigger.
What Are the Best CFO Trading Strategies?
Zero-line crossover with ADX filter: Enter long when CFO crosses above zero and ADX is above 25 — confirming a trend is present before taking the crossover signal. Exit when CFO crosses back below zero. This combination reduces false signals in sideways conditions, which are where crossover strategies fail most often.
Trend confirmation layer: Use CFO as a directional filter rather than a primary entry signal. Only take long entries from another indicator — an EMA crossover, a breakout, a RSI signal — when CFO is positive. Only take shorts when CFO is negative. This single filter can meaningfully reduce the number of counter-trend trades your strategy takes.
Mean reversion on extremes: When CFO reaches an unusually large positive reading and RSI simultaneously shows overbought conditions, price may be overextended relative to its trend. Use both signals together to look for short-term reversal setups. Apply the inverse logic on extreme negative CFO readings paired with oversold RSI.
What Mistakes Should You Avoid with CFO?
Using CFO as a standalone entry signal: Like most oscillators, CFO works best as a filter or confirmation layer. Zero-line crossovers in isolation generate too many false signals — particularly in choppy, ranging markets. Always pair with a trend-strength indicator like ADX.
Ignoring the broader trend: CFO measures deviation from a short-term regression line. A positive reading in the context of a larger downtrend does not mean the downtrend has ended. Always check the higher timeframe before acting on any CFO signal.
Over-fitting the lookback period: Optimising the lookback period too precisely to historical data creates a strategy that looks strong on the backtest but underperforms live. Use out-of-sample testing — Arrow Algo’s Walk-Forward Analysis tool — to validate CFO settings before deploying capital.
How to Build CFO Strategies in Arrow Algo
Arrow Algo’s no-code visual builder includes a CFO block you can add directly to your strategy canvas. No formulas, no spreadsheets — just connect blocks.
To build a zero-line crossover strategy with a trend filter:
- Add a CFO block and set your lookback period
- Add a Crossover block — connect the CFO output and a zero reference value to detect when CFO crosses above zero
- Add an ADX block with a condition block set to ADX > 25
- Connect both conditions to an AND gate — entries only fire when CFO crosses up AND trend is confirmed
- Connect the AND gate output to your Entry block
- Define your exit: a CFO cross back below zero, a trailing stop, or a fixed take-profit level
Run a backtest across at least 12 months of historical data before evaluating results. Test different CFO lookback periods and check whether the strategy holds up on out-of-sample data using Walk-Forward Analysis. Visit the Arrow Algo documentation for full details on available indicator blocks.
Key Takeaways
- CFO measures the percentage deviation of the current close from its n-period linear regression value
- Positive readings mean price is above its trend; negative readings mean price is below trend
- Zero-line crossovers, extreme readings, and divergence are the three primary signal types
- CFO works best as a confirmation layer — pair with ADX or RSI for higher-quality entries
- Arrow Algo’s no-code block builder lets you build, backtest, and run CFO strategies without writing any code
Disclaimer: This content is for educational purposes only and does not constitute financial advice. Trading involves significant risk and you should only trade with capital you can afford to lose. Past performance is not indicative of future results. Always conduct your own research before making any trading decisions.
Ready to build your own automated trading strategies without writing a single line of code? Start for free at Arrow Algo and join thousands of traders who’ve made the switch to systematic trading.