
Dead Cat Bounce: How to Avoid Buying the Fake Rally
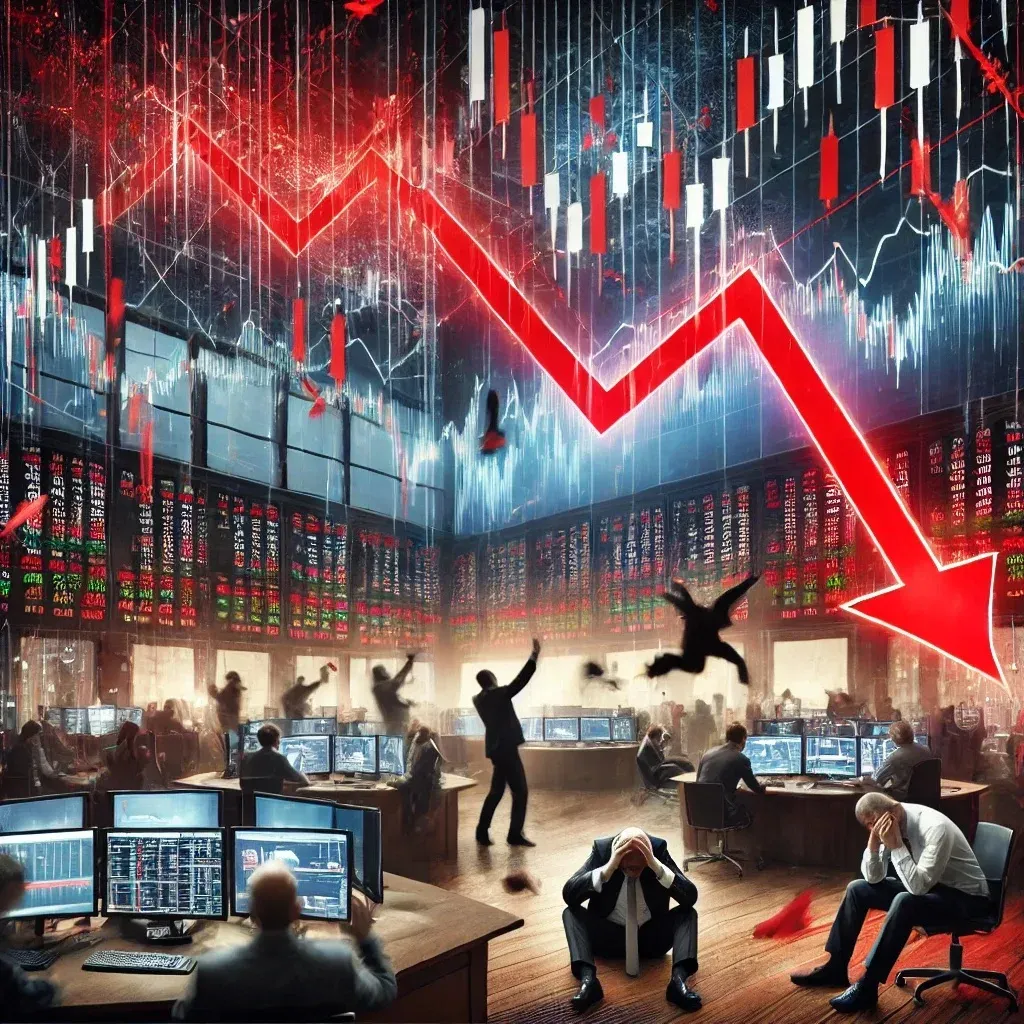
Every downtrend produces at least one dead cat bounce, and most of them look exactly like the bottom. That is the whole problem. A relief rally and a genuine reversal are identical for the first few candles. The difference only shows up later, by which point the bottom-pickers are already positioned.
Friday’s altcoin bounce gave a chunk of itself back on Monday. That was a small-scale version. The full-scale version is the rally that runs 20% or 30% inside a bear market, pulls in everyone who was waiting for the turn, and then rolls over to new lows.
This post covers what a dead cat bounce is, why it is so convincing, who is actually doing the buying, and the rules a systematic trader can use to tell a bounce from a bottom without guessing.
What Is a Dead Cat Bounce?
A dead cat bounce is a temporary recovery in an asset that is in a sustained decline, followed by a continuation of that decline. The name comes from a grim old market joke. Even a dead cat will bounce if it falls from high enough.
The key word in the definition is “followed”. A bounce is only a dead cat bounce once the decline resumes. Until then it is just a bounce. Nobody can label it in real time with certainty. Investopedia’s entry makes the same point: the pattern is confirmed in hindsight.
That is exactly why it belongs in a systematic trading discussion. If the pattern cannot be identified at the time, then the decision cannot rest on identifying it. It has to rest on rules that behave sensibly whether the bounce holds or fails.
Why Relief Rallies Feel Like Bottoms
The largest single-day gains in stock market history did not happen in bull markets. They happened in 1929, 1931, 1932, 2008 and 2020, in the middle of crashes. The S&P 500’s record daily gains cluster inside its worst years.
Crypto follows the same script. In early 2022 Bitcoin fell from $69,000 to around $33,000, then rallied to nearly $48,000 by late March. A 45% gain from the low. It felt like the bear market was over. Three months later Bitcoin traded at $17,600.
Sharp rallies inside downtrends are violent because the setup is violent. Sentiment is washed out. Short positioning is heavy. Anyone still holding has convinced themselves the low is in. When price ticks up, all of that resolves at once.
The emotional trap is that the rally confirms what you wanted to believe. The buy the dip instinct works in uptrends because pullbacks recover. In a downtrend, the same instinct gets you positioned at the top of every bounce.
Who Is Actually Buying?
The way to think about a bounce is to ask where the demand comes from. There are three sources, and only one of them lasts.
Short covering. Traders who are short must buy to close. When price rises, their losses grow, and eventually the exchange or their own stop closes the position for them. That buying is forced, fast, and finite. Once the shorts are gone, so is the demand. A short squeeze looks like strength and is really the removal of sellers.
Mean reversion systems and bottom-pickers. Algorithms that buy oversold readings fire on the first bounce. Discretionary traders who missed the last low buy this one. This demand is real but shallow. It is looking for a quick exit, not a long hold.
Accumulation. Buyers who intend to hold for months. Spot buying, not leverage. This is the only demand that builds a floor, and it leaves fingerprints: higher lows over weeks rather than days, volume on up-days exceeding volume on down-days, and a reclaimed level that holds on the retest.
The first two produce a bounce. Only the third produces a bottom. Your rules need to wait for evidence of the third.
How Long Should You Wait Before Trusting a Bounce?
Waiting has a cost. Confirmation rules mean you miss the first leg. That is the price of not buying every failed bounce, and it is a price worth paying. Four checks do most of the work.
Reclaim and hold. Identify the level the market broke down through on the way in. A real reversal closes back above that level and stays there for a defined number of candles. A dead cat bounce typically tags it and fails. On the daily chart, three to five closes above the level is a reasonable starting point.
Wait for the higher low. The first bounce is unreliable. The pullback after it is the information. If the pullback holds above the original low, buyers defended it. If it does not, the bounce was short covering. Rules that enter on the higher low, not the first rally, avoid most traps.
Check the regime. Price below a long moving average with the average sloping down is a downtrend, and bounces inside it are guilty until proven innocent. Require the slope to flatten, or price to close above the average, before switching from bear rules to bull rules. This is the same logic that runs bear market trading systems.
Size for the counter-trend. If you want to trade the bounce itself, treat it as what it is. Half size, a stop under the bounce low, and a time stop. A bounce that has not made progress within a few candles is probably not the bottom.
The mid-September Bitcoin low near $75,000 is a live case. Two weeks on, the recovery has produced a higher low, reclaimed $80,000, and been backed by about $2.4 billion of ETF inflows in a single week. Those are accumulation fingerprints. The rules would have entered later than a bottom-picker did, but they would have entered, and they would have stayed out of the failed bounces in between.
How to Apply Dead Cat Bounce Filters in Arrow Algo
All of this is buildable with drag-and-drop visual blocks. No code required.
Start with the regime. Drop an EMA block set to 200 and a comparison block that checks whether the close is above it. That output becomes the gate every long entry must pass through.
For the breakdown level, use a Max block over a lookback of 30 to 50 candles, or a Donchian block for the same job. This gives you the prior swing level. A crossover block fires when the close crosses back above it.
For “hold for N candles”, wire the crossover into a Counter block. Require the count to reach three or five before the entry is allowed. A Latch block keeps the state until it resets. Together they encode “reclaim and hold” without any programming.
For the higher-low condition, use a Min block over a short lookback and compare it against the Min over a longer lookback. If the recent low is above the older low, the higher low is in place.
Join the regime gate, the hold count and the higher-low check with a condition block set to AND. Only when all three agree does the entry fire. Attach an ATR block for the stop distance and a Timer block for the time stop.
Then backtest it across the 2022 bear market and the 2018 bear market. Arrow Algo pulls candles straight from Binance, Coinbase and HyperLiquid, so those failed bounces are in the data. Count how many the rules avoided and how much of the eventual recovery they still captured.
What Are the Key Takeaways?
- A dead cat bounce is only identifiable in hindsight, so the decision cannot depend on identifying it.
- The sharpest rallies happen inside downtrends. Violence is not evidence of a bottom.
- Short covering and bottom-picking produce bounces. Only accumulation produces bottoms.
- Wait for a reclaimed level that holds, a higher low, and a regime shift before switching to bull rules.
- If you trade the bounce anyway, size it as a counter-trend trade with a hard stop and a time stop.
- Encode the wait as rules. Rules do not care whether this time feels different.
Disclaimer: This content is for educational purposes only and does not constitute financial advice. Trading involves significant risk and you should only trade with capital you can afford to lose. Past performance is not indicative of future results. Always conduct your own research before making any trading decisions.
Ready to build your own automated trading strategies without writing a single line of code? Start for free at Arrow Algo and join thousands of traders who've made the switch to systematic trading.