
EMA Crossover Strategy: How to Build It in Arrow Algo
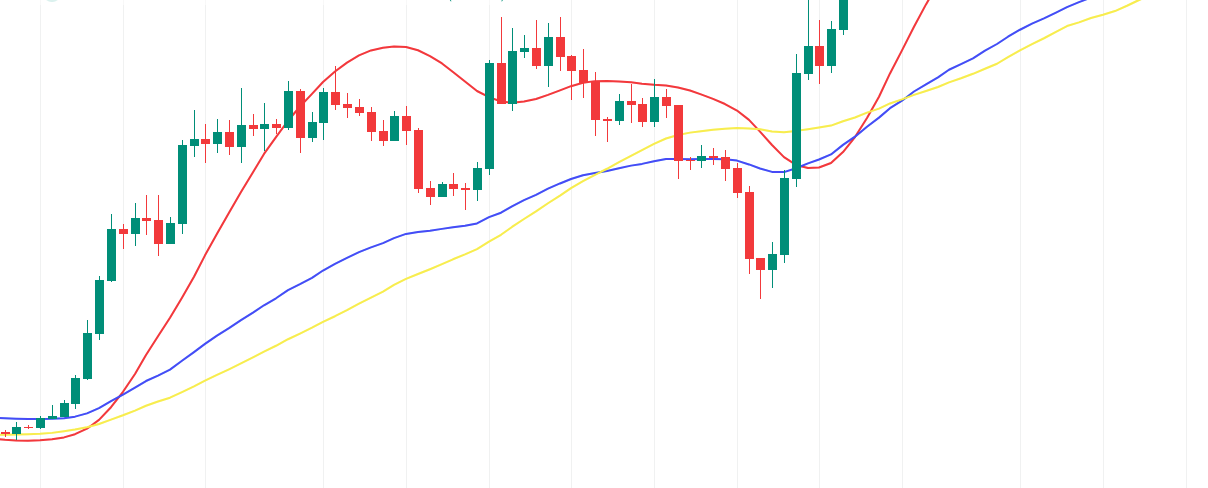
The EMA crossover strategy is one of the most widely-used approaches in algorithmic trading — and one of the simplest to automate. It generates clear, rules-based entry and exit signals by tracking the interaction between two Exponential Moving Averages, making it a natural starting point for systematic traders building their first strategies.
What Makes the EMA Crossover Strategy Work?
The Exponential Moving Average is a trend-following indicator that places more weight on recent price data. Unlike a Simple Moving Average, which treats all historical prices equally, the EMA reacts faster to new information — it is more responsive to the current price environment.
The crossover strategy uses two EMAs: a fast one and a slow one. When the fast EMA crosses above the slow EMA, recent prices are accelerating upward — a bullish signal. When it crosses below, momentum is turning negative — a bearish signal. The logic captures the moment when short-term momentum diverges from the longer-term trend.
How Do EMA Crossover Signals Form?
Every crossover signal has the same anatomy. The fast EMA reflects short-term momentum. The slow EMA smooths out noise over a longer period. The signal fires at the bar where the two lines swap positions.
Common period pairings include:
- 9 / 21: Short-term and reactive. Common on 1-hour and 4-hour charts in crypto.
- 12 / 26: Medium-term. The same periods used in the MACD indicator.
- 20 / 50: Medium-to-long term. Often used on daily charts for swing strategies.
- 50 / 200: The Golden Cross and Death Cross. Long-term institutional signal watched by fund managers.
Shorter periods react faster but generate more false signals. Longer periods are slower but produce more reliable signals in strongly trending conditions.
When Does the EMA Crossover Strategy Perform Best?
The EMA crossover is a trend-following tool. It performs best in markets with sustained directional movement — strong uptrends or downtrends where the fast EMA stays consistently above or below the slow EMA for an extended period.
In ranging or sideways markets, the two EMAs repeatedly cross back and forth, generating a series of small losses — commonly called whipsaws. Adding a trend-strength filter, such as ADX above 25, disables signals during ranging conditions and improves overall performance significantly.
Higher timeframes produce fewer but more reliable signals. The 4-hour and daily charts tend to work better than the 1-minute or 5-minute charts, where short-term noise dominates the signal.
What Are the Most Common EMA Crossover Mistakes?
Over-optimising period settings: Testing every possible EMA pair and selecting the best performer on historical data is overfitting. Standard pairs (9/21, 12/26) tend to generalise better across different market conditions than highly optimised settings that only worked on the specific test data.
Running it in ranging markets without a filter: The crossover strategy was designed for trending conditions. Without a regime filter, it produces consistent small losses in sideways markets. See our post on the MACD Crossover Strategy for a related example of how crossover filters work in practice.
Ignoring volume: A crossover with no accompanying increase in volume is less reliable. Strong signals are typically backed by above-average volume, confirming that buyers or sellers are genuinely engaged.
Treating every crossover as equal: A crossover that aligns with a key support level, a multi-timeframe trend, or a volume spike carries more weight than an isolated crossover in a quiet market. Context matters more than the signal alone.
What Are the Best EMA Crossover Trading Approaches?
Trend-following entry: Enter in the direction of the crossover. Buy when the fast EMA crosses above the slow EMA; exit when it crosses below. Hold the position until the opposite crossover fires. Works best in sustained trends with clear directional momentum.
Pullback entry: Wait for the crossover to confirm the trend direction, then wait for price to retrace toward the fast EMA. Enter when price bounces from EMA support. This reduces entries at extended prices and improves the risk-reward ratio on each trade.
Multi-timeframe confirmation: Use a 50/200 EMA crossover on the daily chart to define the dominant trend. Only take crossover signals on the 4-hour chart in the same direction. This filters out counter-trend noise and keeps the strategy aligned with higher-timeframe momentum.
How to Build an EMA Crossover Strategy in Arrow Algo
Arrow Algo’s drag-and-drop builder makes it simple to build and test an EMA crossover strategy without writing any code.
Start by adding two EMA blocks to your canvas — one set to your fast period (e.g. 9) and one to your slow period (e.g. 21). Connect both EMA outputs to a Cross Over block to detect when the fast EMA crosses above the slow EMA. This becomes your buy signal. For the sell signal, add a second Cross Over block with the inputs reversed.
To add an ADX trend filter, connect an ADX block and wire it to a condition block that checks whether ADX is above 25. Set this condition as a gate that only allows buy signals when the trend is active. Connect the filtered output to your entry block. Without this step, the strategy will generate whipsaws in ranging markets.
Once your strategy is built, run it through Arrow Algo’s backtesting suite across different assets and timeframes. You can compare period settings side by side and see exactly when each crossover signal fired on the chart — without touching a line of code.
What Are the Key Takeaways?
- The EMA crossover strategy generates buy signals when a fast EMA crosses above a slow EMA, and sell signals on the reverse
- It performs best in trending markets — add an ADX filter to reduce false signals in ranging conditions
- Common period pairs: 9/21 (short-term), 12/26 (medium), 50/200 (long-term trend)
- Avoid over-optimising period settings — standard pairs generalise better than highly optimised ones
- Multi-timeframe confirmation strengthens signal quality by aligning entries with the higher-timeframe trend
- Arrow Algo’s visual builder lets you build, test, and run an EMA crossover strategy without any code
Disclaimer: This content is for educational purposes only and does not constitute financial advice. Trading involves significant risk and you should only trade with capital you can afford to lose. Past performance is not indicative of future results. Always conduct your own research before making any trading decisions.
Ready to build your own automated trading strategies without writing a single line of code? Start for free at Arrow Algo and join thousands of traders who’ve made the switch to systematic trading.