
Heikin Ashi (HA): Complete Guide for Algorithmic Trading
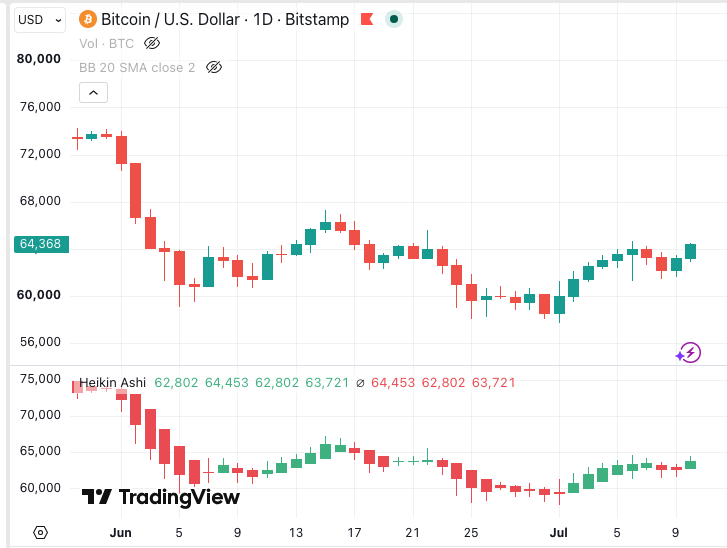
Heikin Ashi (HA) is a charting technique that transforms standard candlestick data into a smoother, trend-clarifying visual by using averaged values rather than raw open, high, low, and close prices. Instead of showing every tick of market noise, Heikin Ashi filters out short-term fluctuations and highlights the underlying trend direction. For algorithmic traders, this makes it a powerful tool for trend identification, entry timing, and filtering out false signals — all without adding a separate overlay indicator to the chart.
What Is Heikin Ashi?
Heikin Ashi (Japanese for “average bar”) originated in Japanese trading methodology, the same tradition that gave rise to standard candlestick charts. Where a standard candle shows the exact open, high, low, and close of each period, a Heikin Ashi candle uses averaged values that incorporate the previous candle’s data.
The result is a chart that looks similar to standard candlesticks but behaves differently: consecutive up candles during an uptrend show no lower wicks, and consecutive down candles during a downtrend show no upper wicks. Reversals appear as Doji-like candles with wicks on both sides. Trends appear cleaner and longer-lasting than on a standard chart because the averaging process smooths the choppiness between candles.
One important note: Heikin Ashi prices are not real market prices. A Heikin Ashi candle open is not the actual market open for that period. This matters for strategy construction — entries and exits based on Heikin Ashi signals must convert back to real price levels for execution.
How Is Heikin Ashi Calculated?
Each Heikin Ashi candle uses four values, all derived from real OHLC data:
- HA Close: The average of the real open, high, low, and close: (Open + High + Low + Close) ÷ 4
- HA Open: The average of the previous Heikin Ashi candle’s open and close: (Previous HA Open + Previous HA Close) ÷ 2
- HA High: The highest value among the real high, HA Open, and HA Close
- HA Low: The lowest value among the real low, HA Open, and HA Close
Because each HA candle depends on the previous one, the values smooth progressively over time. The first candle in a series uses real OHLC as its starting point; every subsequent candle carries forward the averaged state.
How to Read Heikin Ashi Signals
Heikin Ashi candles produce several distinct visual patterns that systematic traders translate into rules:
- Consecutive hollow (green) candles with no lower wicks: Strong uptrend in progress. The absence of lower wicks means price never pulled back below the HA open during those periods — pure buying pressure.
- Consecutive filled (red) candles with no upper wicks: Strong downtrend in progress. Pure selling pressure — price never recovered above the HA open.
- Candles with small bodies and wicks on both sides: Trend losing momentum or potential reversal. These Doji-like HA candles signal indecision and often precede a directional change.
- Transition from filled to hollow (or hollow to filled): Trend change signal. A red candle followed by a green candle with a long lower wick, or vice versa, marks the point where momentum begins to shift.
Because of the averaging smoothing, Heikin Ashi signals lag slightly behind real price action. This lag reduces false signals but means entries and exits occur after the real-market turning point. Systematic strategies typically accept this lag as the cost of higher signal quality.
What Are the Best Heikin Ashi Trading Strategies?
Trend continuation entry: Enter a long when consecutive green HA candles with no lower wicks appear, confirming an uptrend. Hold the position until a wick-on-both-sides Doji or a switch to red candles signals the trend is exhausting. This produces fewer trades than a standard moving average crossover but with higher trend-following accuracy.
HA + EMA trend filter: Combine Heikin Ashi candle colour with a long-period EMA. Only take long entries when HA candles are green AND price is above the EMA. Only take shorts when HA candles are red AND price is below the EMA. The dual-filter removes the weakest signals and keeps the strategy aligned with the dominant trend.
HA reversal signal: Use the Doji-like HA candle (body near zero, wicks both sides) as an early warning that the current trend is stalling. Combine with a momentum oscillator — RSI approaching an extreme, for example — to build a mean-reversion or trend-exit signal with HA as the trigger and RSI as the confirmation.
What Are Common Heikin Ashi Mistakes?
- Using HA prices for stop-loss and take-profit levels: HA prices are averages, not real market prices. Set all order levels using real OHLC values, not the HA candle body edges — otherwise your stops may sit at levels the market never actually traded.
- Entering at the HA signal without checking real price: A green HA candle may appear while real price has already moved significantly above the HA open. Always verify the actual market price before entering.
- Assuming HA signals act instantly: The smoothing creates lag. Expecting immediate reversals at the first Doji candle leads to premature exits from good trends. Allow the signal to confirm over two or three candles before acting.
- Using HA on very short timeframes: On 1-minute or 3-minute charts, the smoothing effect is minimal and the lag becomes a significant disadvantage. Heikin Ashi works best on 15-minute, 1-hour, 4-hour, and daily timeframes.
- Ignoring volume: Strong HA trend candles with declining volume often precede reversals. Confirming HA trend signals with volume analysis adds a meaningful quality filter.
How to Build Heikin Ashi Strategies in Arrow Algo
Arrow Algo includes the Heikin Ashi block in its visual builder. It calculates HA values automatically for your chosen timeframe and outputs the HA open, close, high, and low — which you can connect directly to condition blocks, comparison logic, and entry triggers without writing any code.
A basic Heikin Ashi trend strategy in Arrow Algo’s drag-and-drop canvas:
- Add the Heikin Ashi block and select your target timeframe.
- Connect the HA Close and HA Open outputs to a condition block: fire a bullish signal when HA Close is greater than HA Open (green candle) and a bearish signal when HA Close is less than HA Open (red candle).
- Add an EMA block on a longer timeframe and require price to be above it before long entries trigger. This keeps the strategy trend-aligned.
- Wire the entry to an order block with position sizing and stop-loss logic. Set your stop using real price levels, not HA values.
- Add a consecutive candle counter — for example, require two or three consecutive green HA candles before entering. This reduces lag-related false entries at the start of weak moves.
- Run a backtest in Arrow Algo to measure performance across different market regimes before going live.
For more on combining HA with momentum-based confirmation, see our guide on momentum trading.
What Are the Key Takeaways?
- Heikin Ashi uses averaged OHLC values to smooth standard candlestick data, making trends clearer and reducing noise.
- Consecutive green candles with no lower wicks signal a strong uptrend; consecutive red candles with no upper wicks signal a strong downtrend.
- Doji-like HA candles with wicks on both sides signal trend exhaustion or reversal.
- HA prices are averages, not real market prices — never use them for stop-loss or take-profit placement.
- HA signals lag slightly behind real price; confirm over multiple candles and use higher timeframes.
- Combining HA candle colour with an EMA filter produces a clean, low-noise trend-following signal.
- Arrow Algo’s Heikin Ashi block outputs HA values directly into your visual strategy canvas with no coding required.
Disclaimer: This content is for educational purposes only and does not constitute financial advice. Trading involves significant risk and you should only trade with capital you can afford to lose. Past performance is not indicative of future results. Always conduct your own research before making any trading decisions.
Ready to build your own automated trading strategies without writing a single line of code? Start for free at Arrow Algo and join thousands of traders who’ve made the switch to systematic trading.