
Information Ratio: Measure Your Strategy's Consistent Edge
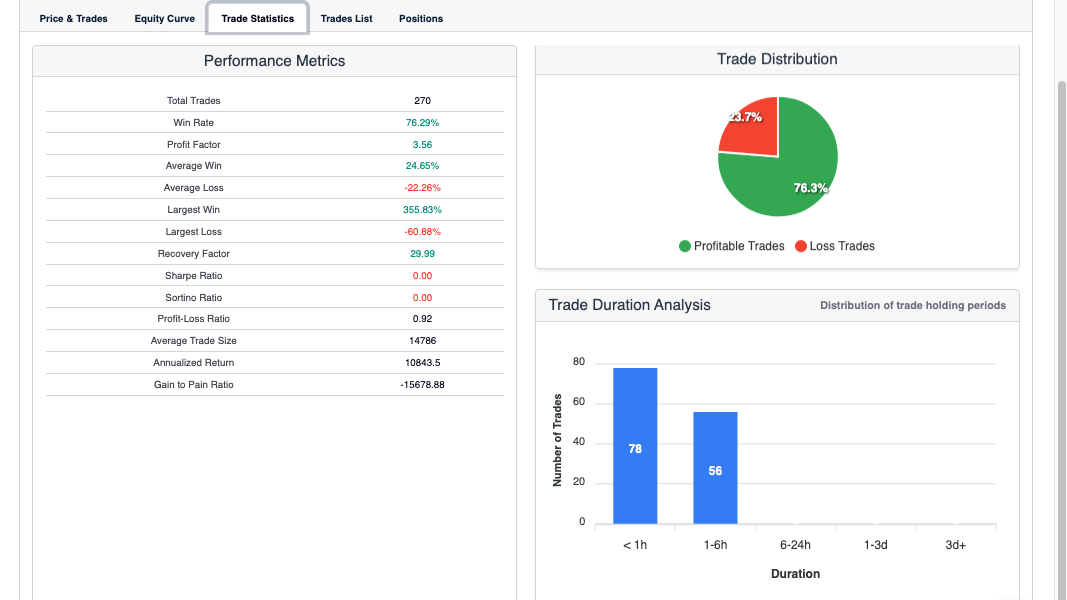
The information ratio measures how consistently a trading strategy generates returns above a benchmark, relative to how much it deviates from that benchmark. Where the Sharpe ratio tells you how much return you earn per unit of total risk, the information ratio tells you how reliably you outperform — separating persistent alpha generation from results that are simply volatile.
What Is the Information Ratio?
The information ratio is a performance metric that divides a strategy’s excess return over a benchmark by the tracking error — the standard deviation of those excess returns. A high information ratio means the strategy consistently beats its benchmark by a stable margin. A low information ratio means the outperformance is inconsistent, erratic, or largely driven by a few lucky periods rather than a repeatable edge.
The formula is: active return divided by tracking error. Active return is the strategy’s return minus the benchmark return over the same period. Tracking error is how much that active return varies from period to period. The ratio compresses both into a single number that answers one question: is this outperformance reliable?
Why the Information Ratio Matters
Any strategy can beat a benchmark over a specific period. The question is whether it does so because of a genuine edge — or because of a stretch of luck, a favourable regime, or concentrated exposure to a single factor that happened to work.
The information ratio filters for consistency. A strategy that beats its benchmark by 8% one year, underperforms by 5% the next, and beats by 12% the year after has generated positive active return on average. But the high tracking error keeps the information ratio low — the outperformance is not reliable enough to be trusted as a sustained edge.
A strategy that beats its benchmark by 4% every single year, with minimal deviation, produces a high information ratio despite lower headline returns. That consistency is worth more to a systematic trader than intermittent large outperformance, because it signals a genuine, repeatable process rather than regime-dependent luck. This is closely related to the concept of alpha in algorithmic trading — the information ratio is how you measure whether your alpha is real.
What Is a Good Information Ratio?
Generally accepted thresholds:
- Below 0.5: Weak. The strategy is not consistently outperforming its benchmark. The active return is too noisy relative to its size.
- 0.5 to 1.0: Solid. The outperformance is meaningful and reasonably consistent. This range covers many well-regarded systematic strategies.
- Above 1.0: Strong. Consistent, reliable outperformance. Difficult to sustain over long periods in competitive markets.
- Above 2.0: Exceptional. Rare in practice. Treat very high readings with scepticism — they often indicate a short track record, a favourable regime, or data issues.
These thresholds are guidelines, not hard rules. Context matters: a higher information ratio is expected from a short-term strategy with many trades than from a long-term position strategy with few data points.
Information Ratio vs Sharpe Ratio
The Sharpe ratio measures return per unit of total risk — volatility relative to the risk-free rate. It does not care about a benchmark. The information ratio measures return per unit of active risk — volatility relative to a chosen benchmark. It does not care about total risk.
Use the Sharpe ratio to evaluate a strategy in isolation: is it generating enough return for the risk it takes? Use the information ratio to evaluate a strategy relative to an alternative: is it consistently beating what you could have held passively instead?
For crypto algorithmic strategies, a common benchmark is Bitcoin buy-and-hold. An information ratio above 0.5 against a BTC benchmark means the strategy is consistently extracting value beyond what simple passive exposure would have delivered — which is the actual purpose of running an active algorithm.
How to Use the Information Ratio in Arrow Algo
Arrow Algo’s backtesting suite gives you the performance data needed to calculate and monitor your information ratio across strategy iterations.
First, define your benchmark. For a BTC-focused strategy, use BTC buy-and-hold over the same backtest window. For a multi-asset or altcoin strategy, consider a market-cap-weighted basket or the relevant exchange index. Run both the strategy and the benchmark over the same period in Arrow Algo’s backtester.
Calculate the active return for each sub-period — monthly works well for most strategy timeframes. Subtract the benchmark return from the strategy return each period. Average those active returns, then divide by their standard deviation. That is your information ratio for the backtest window.
When comparing strategy versions or parameter settings, the information ratio is a more honest comparator than total return alone. A version that generates 60% return with an IR of 0.4 is less reliable than a version generating 45% return with an IR of 0.9. The second version’s edge is more likely to persist out of sample.
What Are the Key Takeaways?
- The information ratio measures consistency of outperformance — active return divided by tracking error
- A high information ratio means the strategy reliably beats its benchmark; a low one means the outperformance is erratic
- Thresholds: below 0.5 is weak, 0.5–1.0 is solid, above 1.0 is strong
- Use the information ratio alongside the Sharpe ratio — Sharpe evaluates total risk, information ratio evaluates active risk relative to a benchmark
- For crypto strategies, BTC buy-and-hold is a natural benchmark; an IR above 0.5 means the algorithm adds genuine value over passive exposure
- Arrow Algo’s backtester gives you the sub-period return data needed to calculate and compare information ratios across strategy iterations
Disclaimer: This content is for educational purposes only and does not constitute financial advice. Trading involves significant risk and you should only trade with capital you can afford to lose. Past performance is not indicative of future results. Always conduct your own research before making any trading decisions.
Ready to build your own automated trading strategies without writing a single line of code? Start for free at Arrow Algo and join thousands of traders who’ve made the switch to systematic trading.