
MACD Divergence Strategy: How to Build It in Arrow Algo
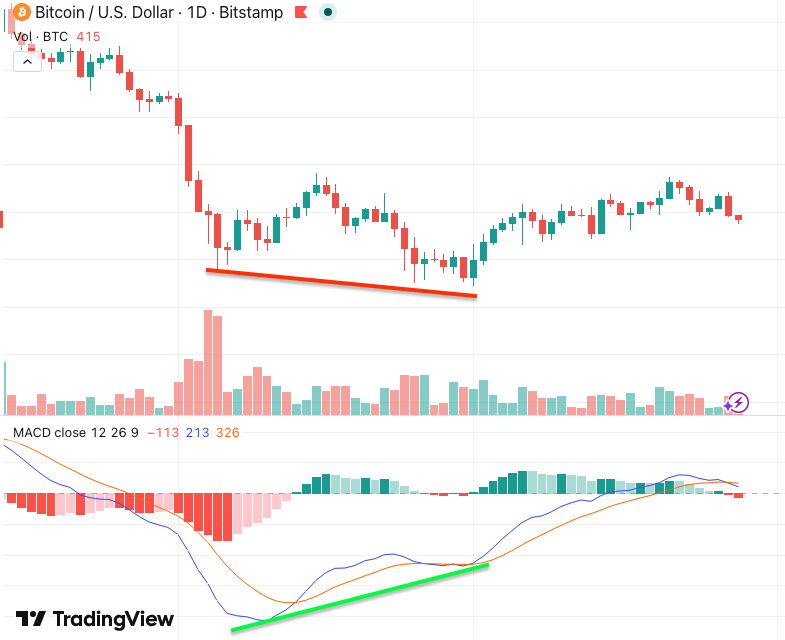
The MACD divergence strategy is one of the most widely used reversal techniques in systematic trading. It identifies moments when price momentum disagrees with price direction — giving algorithmic traders an early warning before a trend changes course.
Unlike a standard MACD crossover entry — which waits for momentum to already shift — a divergence strategy attempts to identify the turning point earlier. The trade-off is slightly more risk but a potentially better entry price with a tighter stop.
This guide covers how the MACD divergence strategy works, how to read its signals accurately, and how to build it in Arrow Algo without writing a single line of code.
What Is MACD Divergence?
MACD divergence occurs when the Moving Average Convergence Divergence (MACD) indicator moves in the opposite direction to price. Price makes a new high, but MACD makes a lower high. Or price makes a new low, but MACD makes a higher low.
This disagreement between price and momentum is the divergence signal. It suggests the current trend is losing strength before price has confirmed the reversal.
There are two main types:
- Bearish divergence: Price prints a higher high; MACD prints a lower high. Signals a potential downside reversal.
- Bullish divergence: Price prints a lower low; MACD prints a higher low. Signals a potential upside reversal.
A third type — hidden divergence — signals trend continuation rather than reversal. Hidden bullish divergence occurs when price makes a higher low but MACD makes a lower low. Hidden bearish divergence occurs when price makes a lower high but MACD makes a higher high.
How Does the MACD Divergence Strategy Work?
The MACD indicator compares two exponential moving averages — typically the 12-period and 26-period EMA. The MACD line is the difference between them. A 9-period EMA of the MACD line acts as the signal line.
Divergence detection compares swing highs and lows in price against swing highs and lows in the MACD line over a lookback window.
In plain terms, the process runs as follows:
- Price forms a new swing high or low
- MACD does not confirm it with its own new high or low in the same direction
- A MACD crossover then confirms the reversal
The crossover is the trigger. Divergence is an observation. The entry fires only when both conditions are met.
How to Spot MACD Divergence Signals
Bullish divergence: Price forms a lower low. The MACD histogram or MACD line forms a higher low over the same lookback. Confirmation: the MACD line crosses above the signal line. Entry: go long on the confirmed crossover.
Bearish divergence: Price forms a higher high. MACD forms a lower high over the same lookback. Confirmation: the MACD line crosses below the signal line. Entry: go short or exit longs on the confirmed crossover.
The swing comparison window matters. Swings that are only a few candles apart produce noise. Most robust implementations look for swing points that are at least 5 to 15 candles apart — clearly distinct peaks and troughs rather than minor fluctuations.
Which MACD Divergence Setups Work Best?
Reversal entry with ATR stop
Identify regular bullish or bearish divergence. Wait for MACD crossover confirmation. Enter in the reversal direction. Place a stop-loss using ATR beyond the swing point that created the divergence. This is the most straightforward approach and works across multiple timeframes.
Divergence with 200 EMA trend filter
Add a 200-period EMA to define the dominant trend direction. Only take bullish divergence entries when price is above the EMA. Only take bearish divergence entries when price is below it. This filters out low-probability counter-trend signals in strongly trending markets.
Multi-timeframe confirmation
Look for divergence on a higher timeframe — such as the 4-hour chart — to confirm the reversal thesis. Then time the entry on a lower timeframe — such as the 1-hour chart — once the MACD crossover fires. This approach improves signal quality by requiring agreement across two timeframes before an entry is triggered.
For a comparison with other MACD-based approaches, see the guide on the MACD crossover strategy.
What Mistakes Kill MACD Divergence Trades?
Entering on divergence before the crossover
Price can extend the original trend for many candles after divergence forms. Entering without waiting for the MACD crossover confirmation leads to premature entries and unnecessary losses. The crossover is non-negotiable as a filter.
Using too short a swing lookback
If the comparison window between swing points is only two or three candles, the signal is noise. Require clearly separated swing points — at least 5 to 15 candles between peaks or troughs — for the divergence to be meaningful.
Fading strong trends without a filter
Bearish divergence in a powerful bull trend produces many false signals. Without a trend filter, you will repeatedly fade momentum that has not exhausted itself. A 200-period EMA solves this by preventing counter-trend entries in strongly trending conditions.
Over-optimising the MACD settings
The default 12/26/9 settings perform well across most assets and timeframes. Adjusting them purely to improve historical backtest results often produces curve-fitting. Test any modified parameters on out-of-sample data before using them in a live strategy.
Skipping the stop-loss
Every divergence signal has a clear invalidation point: the swing high or low that generated the divergence. If price returns to break that swing, the trade thesis is wrong. Place your stop there, not at an arbitrary fixed distance.
How to Build a MACD Divergence Strategy in Arrow Algo
Arrow Algo’s visual block builder lets you construct this strategy by dragging and connecting blocks on a canvas — no programming required. Here is the setup:
- Add a MACD block — set your periods (default 12/26/9). The block outputs the MACD line, signal line, and histogram.
- Add price swing detection — use Max and Min blocks over your chosen lookback to identify recent swing highs and lows in price.
- Add MACD swing detection — repeat with the MACD line as the input to find MACD swing highs and lows over the same window.
- Build the divergence condition — use comparison blocks to check whether price swings and MACD swings are moving in opposite directions.
- Add crossover confirmation — connect a Crossover block to confirm the MACD line has crossed the signal line before triggering the entry.
- Set entry and exit blocks — enter long on bullish divergence plus bullish crossover; exit on the next bearish crossover or a fixed take-profit target.
- Add a stop-loss block — use ATR to set a dynamic stop placed beyond the divergence swing point.
Run a backtest across multiple market conditions before deploying live. Pay particular attention to how the strategy behaves in trending versus ranging environments, as performance can differ significantly between the two.
Key Takeaways
- The MACD divergence strategy spots reversals by comparing price swings to MACD swings moving in opposite directions
- Bullish divergence (price lower low, MACD higher low) signals potential upside reversals; bearish divergence signals potential downside reversals
- Always wait for the MACD crossover confirmation before entering — divergence alone is not a trigger
- Use a 200-period EMA trend filter to avoid fading strong trends
- Require at least 5–15 candles between swing points to filter out noise
- Place ATR-based stops beyond the divergence swing point for consistent invalidation logic
- Arrow Algo’s visual block builder lets you construct and backtest this strategy without writing code
Disclaimer: This content is for educational purposes only and does not constitute financial advice. Trading involves significant risk and you should only trade with capital you can afford to lose. Past performance is not indicative of future results. Always conduct your own research before making any trading decisions.
Ready to build your own automated trading strategies without writing a single line of code? Start for free at Arrow Algo and join thousands of traders who’ve made the switch to systematic trading.