
MACD Histogram Strategy: How to Build It in Arrow Algo
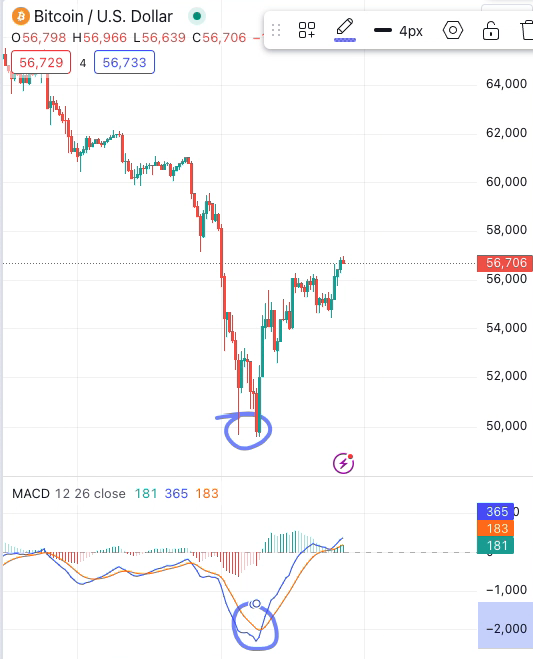
The MACD histogram strategy uses the gap between the MACD line and its signal line — displayed as a series of bars — to identify momentum shifts before they appear clearly in price action. Where a standard MACD crossover waits for confirmation, the histogram gives an earlier read on whether buying or selling pressure is building or starting to fade.
What Does the MACD Histogram Actually Measure?
The MACD histogram is not a standalone indicator. It is derived directly from the standard MACD calculation.
The MACD line is the difference between a 12-period and 26-period exponential moving average. The signal line is a 9-period EMA of the MACD line. The histogram then plots the gap between the two: MACD line minus signal line.
When the histogram is positive and growing, bullish momentum is accelerating. When positive but shrinking, bullish pressure is easing. When negative and deepening, bearish pressure is building. When negative but flattening, sellers are losing control.
The direction of histogram movement — not its raw value — is where the strategy signals come from.
How the MACD Histogram Generates Trading Signals
There are three primary ways the histogram produces actionable entries:
Zero-line crossovers: When the histogram crosses from negative to positive, the MACD line has crossed above the signal line. This is the same signal as a standard MACD crossover. It confirms a momentum shift but arrives with some lag relative to the underlying move.
Histogram divergence: Price makes a new high or low but the histogram fails to confirm it. Bearish divergence appears when price sets a higher high but the histogram posts a lower high. Bullish divergence appears when price sets a lower low but the histogram posts a higher low. Both signal weakening momentum in the prevailing direction.
Peak and trough signals: When the histogram stops growing and prints a smaller bar in the same direction, momentum is fading. A bar smaller than the previous one — even while still positive or negative — gives an early warning that the current move may be stalling. This is the most sensitive of the three approaches and requires the strongest filtering.
Three MACD Histogram Strategy Setups Worth Building
Setup 1: Histogram shrinkage entry
Enter long when the histogram is negative and the current bar is smaller — less negative — than the previous bar. Selling pressure is easing. Combine with price holding above a key moving average to avoid entering into a strong downtrend. Exit when the histogram turns positive and then begins to shrink again.
Setup 2: Histogram divergence with trend confirmation
Identify bearish divergence: price makes a higher high but the histogram posts a lower high. Enter short when the histogram subsequently crosses below zero. The divergence is the warning; the zero-line cross is the confirmation. Use ATR-based stops to handle the volatility typically present around this type of entry.
Setup 3: Zero-line reload within a trend
In a strong uptrend, the histogram often dips briefly below zero before recovering. Enter when the histogram crosses back above zero while price remains above its 200-period EMA. This treats the brief zero-line test as a reload opportunity within the prevailing trend, rather than a reversal signal.
Timeframe and Pair Considerations
The MACD histogram behaves differently across timeframes. On shorter intervals — 15-minute, 1-hour — it generates more signals with more noise. On daily or 4-hour charts, signals are fewer but more reliable.
The default 12/26/9 settings were designed for daily equity charts. On 1-hour crypto charts, many systematic traders adjust to 5/13/4 or 8/17/9 to account for faster market cycles. Always backtest parameter choices on each pair separately before deploying them in a live strategy.
This week’s FOMC event (Wednesday, 29 July) will likely produce abnormal histogram readings across all pairs as volatility spikes. Consider whether your strategy uses a time-based filter that pauses new entries around major macro events — a practice that can significantly improve real-world performance versus backtest results.
Common MACD Histogram Mistakes to Avoid
The most frequent error is treating every histogram contraction as a reversal signal. In trending markets, the histogram regularly shrinks without the trend actually changing direction. A bar slightly smaller than the previous one in a strong uptrend is often noise, not a setup.
Using the histogram in isolation — without a trend filter, volatility context, or volume confirmation — produces excessive false entries. The signal is most reliable when it agrees with the broader market structure rather than working against it.
Avoid over-optimising MACD settings on historical data. If a parameter sweep shows that 7/14/6 outperforms every other combination in backtesting, that result is almost certainly curve-fitted to past price action. Stick with standard or near-standard settings and validate on out-of-sample periods before committing real capital.
How to Build a MACD Histogram Strategy in Arrow Algo
Arrow Algo’s visual block builder lets you design and test MACD histogram strategies without writing any code. Drag the MACD block onto the canvas and configure the fast period, slow period, and signal period. The block outputs three values: the MACD line, the signal line, and the histogram.
For a histogram shrinkage strategy, use the Lag block to capture the previous bar’s histogram value. Connect both the current and lagged values to a Condition block with appropriate comparison logic. When the condition fires, it triggers your entry signal.
For divergence-based setups, combine the MACD block with Max or Min blocks to identify recent price and histogram extremes. The Condition block handles the comparison between them. Add an EMA block as a trend filter — allow long entries only when price is above the EMA output. Connect an ATR block to size stops dynamically based on current volatility.
The visual canvas makes it straightforward to clone a scenario and test alternative configurations — swap in a zero-line crossover instead of histogram shrinkage, or add a volume filter using the OBV block — without rewriting any logic. For a related approach using MACD line crossovers, see our post on the MACD Crossover Strategy. Start building at Arrow Algo.
Key Takeaways
- The MACD histogram measures the gap between the MACD line and its signal line, showing whether momentum is accelerating or fading.
- Histogram shrinkage provides earlier entries than zero-line crossovers but generates more false signals — a strong trend filter is essential.
- Divergence between price and histogram is one of the more reliable setups, particularly when combined with a zero-line cross for confirmation.
- Default 12/26/9 settings may need adjustment for crypto timeframes shorter than daily.
- Avoid curve-fitting parameter settings — validate any changes on out-of-sample data before going live.
- Arrow Algo’s no-code block builder lets you design, test, and run MACD histogram strategies entirely with drag-and-drop tools.
Disclaimer: This content is for educational purposes only and does not constitute financial advice. Trading involves significant risk and you should only trade with capital you can afford to lose. Past performance is not indicative of future results. Always conduct your own research before making any trading decisions.
Ready to build your own automated trading strategies without writing a single line of code? Start for free at Arrow Algo and join thousands of traders who’ve made the switch to systematic trading.