
Parameter Optimisation: Find the Right Strategy Settings
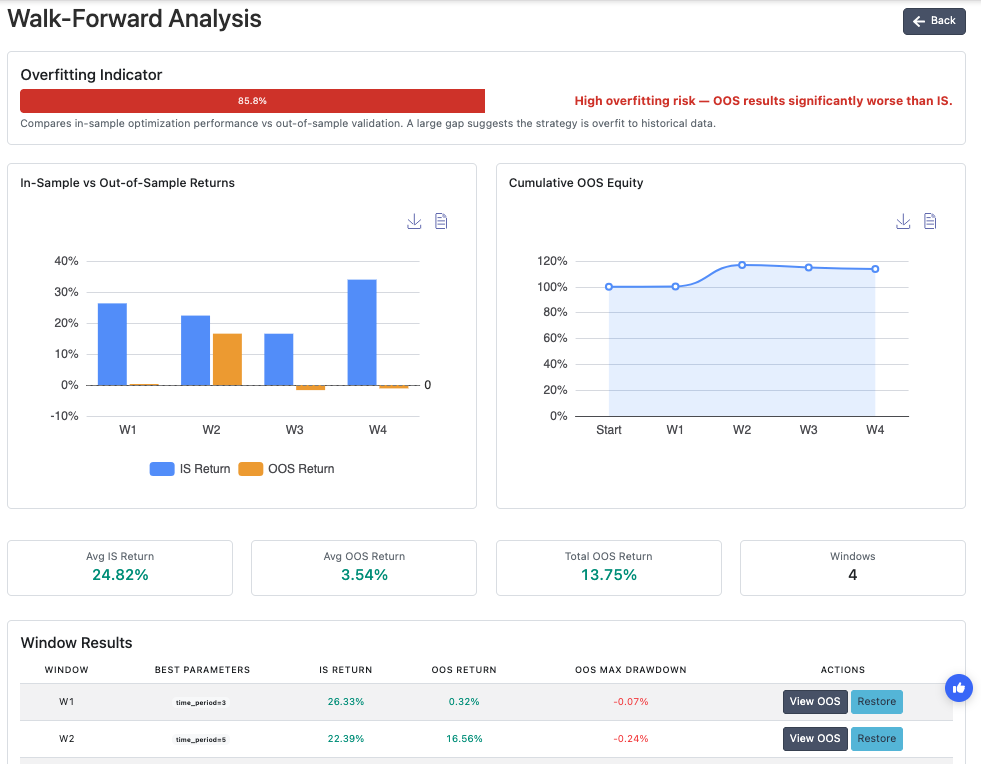
Parameter optimisation is the process of adjusting a trading strategy’s input settings — indicator periods, threshold levels, stop percentages — to find the configuration that produces the best and most reliable performance on a specific asset and timeframe. It is a necessary step in strategy development, but one that carries a significant risk if done incorrectly: overfitting to historical data.
What Is Parameter Optimisation?
Every element of a systematic trading strategy has parameters — values that define its behaviour. The RSI block has a period (default 14). The EMA has a length (50, 100, 200). The entry condition has a threshold (RSI below 30 or below 35). The stop loss has a distance (1.5% or 2.5% or 1.5x ATR).
Parameter optimisation is the process of testing different values for these inputs to find the combination that performs best. It moves a strategy from a generic starting point — using default values designed to be broadly applicable — to a configuration calibrated for a specific market, timeframe, and trading objective.
Why Default Parameters Are Just a Starting Point
Default indicator values are conventions, not optimised solutions. RSI(14) was popularised because it works reasonably well across many markets. It was not designed for BTC on a 4-hour chart in 2026. The same applies to EMA(50), ATR(14), and every other common default.
A strategy built entirely on default parameters is leaving performance on the table. The right RSI period for one asset on one timeframe may be significantly different from the right period for another. The only way to know is to test.
This is not a flaw in the indicators — it is expected. Default values are starting points for exploration, not endpoints. Parameter optimisation is the exploration.
How to Optimise Without Overfitting
The core danger in parameter optimisation is overfitting: tuning parameters so precisely to historical data that the strategy perfectly fits the past but fails to generalise to the future.
The standard defence is a data split:
- In-sample data (typically the first 70%): This is the period you use for testing and optimising parameters. All your adjustments happen here.
- Out-of-sample data (the remaining 30%): This period is set aside and never touched during optimisation. It is used only for final validation once you have selected your parameters.
If your optimised parameters produce comparable results on out-of-sample data as on in-sample, there is evidence that the edge is genuine. If out-of-sample performance collapses, the parameters are overfit to history.
The same principle applies when using walk-forward analysis — the most rigorous validation method available to systematic traders. Walk-forward testing repeatedly optimises on a rolling in-sample window and tests on the next period, across many forward cycles. Consistent performance across multiple out-of-sample windows is strong evidence of a genuine, non-overfit edge.
What Robust Parameters Actually Look Like
The goal of optimisation is not the parameter set with the highest backtest return. It is the parameter set that is most likely to continue working in the future.
A fragile parameter produces a sharp performance peak at one specific value. Set RSI to 28 and returns are strong. Set it to 27 or 29 and performance collapses. This suggests the strategy has been fitted to a historical accident rather than a genuine pattern.
A robust parameter produces a plateau: similar performance across a range of values. RSI performs well anywhere between 24 and 36. The exact value within that range matters little. When you encounter a plateau like this, choose a value near the centre of the stable range — not the single peak value at the edge of it.
Always test a range of values around your chosen parameter. If the strategy’s edge survives across the range, the parameter is robust. If it only works at one precise setting, treat it as a red flag.
How to Optimise Parameters in Arrow Algo
Arrow Algo’s visual block builder lets you adjust every parameter directly through the drag-and-drop interface — no programming required.
The process is straightforward:
- Select a parameter to test — for example, the RSI period. Start with the default (14) and set a range to explore (e.g. 7 to 21, in steps of 1 or 2).
- Run a backtest for each value. Record the key metrics: total return, Sharpe ratio, maximum drawdown, win rate.
- Change one parameter at a time. Changing multiple settings simultaneously makes it impossible to understand which change drove the performance difference.
- Identify the stable performance plateau — the range where results are consistently good — and choose a value from the middle of it.
- Repeat for the next parameter: moving average period, entry threshold, stop distance.
- Once you have candidate parameters, run walk-forward analysis to validate on unseen data before considering any live deployment.
Arrow Algo’s backtest results update immediately after each change, making it practical to test parameter ranges systematically without needing code or external tools. Start building and optimising directly in the visual builder.
Key Takeaways
- Parameter optimisation adjusts indicator periods, thresholds, and risk settings for a specific asset and timeframe
- Default values are broad conventions — they are a starting point, not an optimised solution
- Split your data: optimise on in-sample data, validate on out-of-sample data that was never touched during development
- Prefer robust parameters that produce stable performance across a range of values, not a single sharp peak
- Walk-forward analysis is the strongest validation: it tests optimised parameters on multiple rolling future periods
- Arrow Algo lets you adjust parameters and re-run backtests directly in the visual builder — no code required
Disclaimer: This content is for educational purposes only and does not constitute financial advice. Trading involves significant risk and you should only trade with capital you can afford to lose. Past performance is not indicative of future results. Always conduct your own research before making any trading decisions.
Ready to build your own automated trading strategies without writing a single line of code? Start for free at Arrow Algo and join thousands of traders who’ve made the switch to systematic trading.