
Projection Oscillator (PO): Complete Guide for Algorithmic Trading
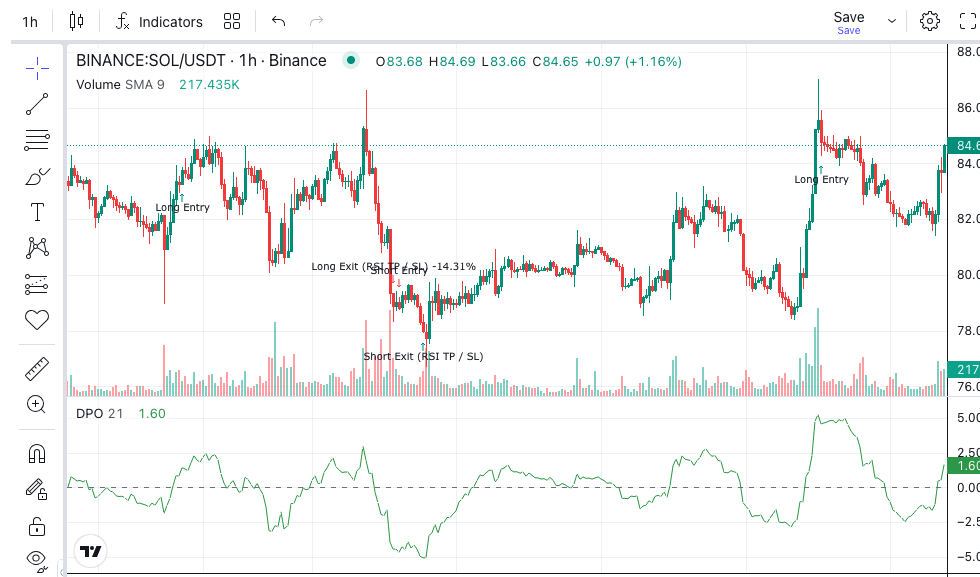
The Projection Oscillator (PO) is a momentum oscillator that measures where the current price sits within a linear regression projection channel — combining the trend-fitting intelligence of linear regression with the overbought/oversold readability of a classic oscillator like the Stochastic.
What Is the Projection Oscillator?
The Projection Oscillator was developed by Mel Widner and published in Technical Analysis of Stocks and Commodities magazine in the 1990s. It works by first constructing a projection channel: an upper and lower boundary derived from a linear regression line fitted to recent price data. The oscillator then expresses where the latest close sits within that channel, scaled from 0 to 100. A reading of 0 means price is at the lower projection boundary and a reading of 100 means it is at the upper boundary. A reading of 50 means price sits exactly on the regression midline. Readings above 70–80 are considered overbought. Readings below 20–30 are considered oversold. The key distinction from the standard Stochastic oscillator — which uses the fixed high-low range of the lookback period — is that the PO’s channel adjusts with the trend direction. In a rising trend, the channel tilts upward. In a falling trend, it tilts downward. This makes the PO less likely to produce persistently “overbought” readings during strong trending moves, which is one of the most common complaints about Stochastic-based systems.
How Is the Projection Oscillator Constructed?
The calculation works in three stages. First, a linear regression line is computed across the lookback period — typically 10 to 14 bars. This line represents the best-fit trend direction for that window. Second, the projection bands are built. The upper band is set at the maximum deviation above the regression line observed within the lookback period. The lower band is set at the maximum deviation below it. These two lines form a channel around the regression line — a channel that tilts with the prevailing trend rather than remaining flat. Third, the oscillator value is calculated: PO = (Close − Lower Band) / (Upper Band − Lower Band) × 100. A trigger line — usually a 3-period simple moving average of the PO — is plotted alongside it. Crossovers between the PO and its trigger line generate entry and exit signals. Because the channel is anchored to the regression trend, the PO naturally accounts for trend direction when measuring overbought or oversold conditions. A price touching the upper band in an uptrend is expected behaviour; the same price touching the upper band in a downtrend is a warning signal.
How to Interpret Projection Oscillator Readings
Overbought and oversold thresholds: PO above 70 suggests the price is pressing the upper boundary of its regression channel — potentially overextended. PO below 30 suggests the price is pressing the lower boundary. These are not automatic reversal signals; context matters. A PO holding above 70 during a strong uptrend can persist for many bars, reflecting the trend rather than predicting a reversal. Trigger line crossovers: When the PO crosses above its trigger line, that is a bullish signal — momentum is accelerating relative to the channel. When it crosses below the trigger line, that is bearish. These crossovers are cleaner than raw PO level changes because the smoothing removes short-term noise. Midline (50) as a trend filter: When the PO is consistently above 50, price is holding above the regression midline — this supports a trending-up interpretation. When it sits consistently below 50, price is below the midline — supporting a down or weakening trend. Some systematic traders use a PO cross of the 50 level as a regime signal rather than an entry trigger. Divergence: When price makes a higher high but the PO makes a lower high, the underlying momentum is weakening even as price climbs. This divergence is often a leading signal for a reversal or correction. The same logic applies in reverse for lower lows and a rising PO at a low.
Projection Oscillator Strategies for Systematic Traders
1. Trigger line crossover in oversold zone Wait for the PO to fall below 30, confirming the price is near the lower boundary of its regression channel. Then enter long when the PO crosses back above its trigger line. This combines an oversold filter with a momentum confirmation — reducing early entries on still-falling momentum. Set an initial stop below the recent swing low. 2. Midline regime-filtered entries Use the PO’s position relative to 50 as a trend regime filter. Only take long entries when the PO is above 50 — meaning price is sustaining above the regression midline. In uptrend conditions, look for short-term PO dips toward 40–50 as pullback entries rather than waiting for an extreme oversold reading. This keeps the strategy aligned with the dominant regression trend rather than fighting it. 3. Divergence-based exits Keep entries driven by a separate signal but use PO divergence to close profitable trades. When price reaches a new swing high but the PO fails to confirm with a new high, close the long position. The regression channel tells you momentum has not kept pace with price — a caution signal that is not always obvious from raw price action alone.
What to Avoid When Using the Projection Oscillator
Using overbought/oversold levels as automatic reversal triggers. The PO’s channel adjusts with the trend, but in a very strong move, the oscillator can sit in extreme territory for extended periods. A PO above 80 in a confirmed uptrend is not a short signal. Always assess the broader trend context before fading an extreme reading. Applying a short lookback period to volatile assets. On crypto assets with high short-term volatility, a 10-bar lookback produces a noisy regression channel and unreliable oscillator readings. A 14 to 20-bar period typically produces more stable signals. Test multiple settings before settling on a period for live deployment. Ignoring the trigger line. Trading raw PO crossings of the 30 or 70 level without waiting for a trigger line confirmation generates significantly more false signals. The trigger line smoothing is a built-in feature of the indicator — use it. Conflating PO with TSF or Linear Regression indicators. The PO uses the same regression foundation as the Time Series Forecast (TSF) and Linear Regression indicators, but measures something different: a normalised position within the channel rather than a projected price level. They are complementary, not interchangeable. For background on linear regression as a concept, Investopedia’s linear regression overview provides a useful foundation.
How to Use the Projection Oscillator in Arrow Algo
Arrow Algo’s no-code visual block builder includes the Projection Oscillator as a native block. Drag the PO block onto your strategy canvas, connect it to your price input, and set the lookback period and trigger smoothing in the block’s properties. To build the trigger line crossover strategy, add a PO block and connect it to candle data. Add a threshold condition block checking whether PO is below 30. Add a crossover condition block monitoring whether the PO line has crossed above its trigger line. Connect both conditions to a Buy block via an AND logic gate — the entry fires only when both criteria are met simultaneously. To apply the midline regime filter, add a condition block that checks whether the PO is above 50. Connect this to the AND gate as a third condition. The strategy now only enters long trades when price is above its regression midline and momentum is recovering from an oversold dip — a cleaner set of conditions than any single threshold alone. Back-test across multiple timeframes and market conditions. Compare the PO’s performance against a standard Stochastic on the same data — the difference in how each handles trending conditions will make the PO’s regression-based advantage clear.
Key Takeaways
- The Projection Oscillator measures where price sits within a linear regression projection channel, scaled from 0 to 100
- Unlike the Stochastic’s fixed high-low range, the PO’s channel tilts with the trend — reducing false overbought signals during sustained moves
- The trigger line (3-period smoothed PO) generates crossover signals; always use it rather than trading raw PO level changes
- Use the 50-midline as a trend regime filter and divergence between price and PO as an exit signal
- Arrow Algo includes a native PO block — build full Projection Oscillator strategies visually without writing any code
Disclaimer: This content is for educational purposes only and does not constitute financial advice. Trading involves significant risk and you should only trade with capital you can afford to lose. Past performance is not indicative of future results. Always conduct your own research before making any trading decisions. Ready to build your own automated trading strategies without writing a single line of code? Start for free at Arrow Algo and join thousands of traders who’ve made the switch to systematic trading.