
R-Multiples: Measure Every Trade in Units of Risk
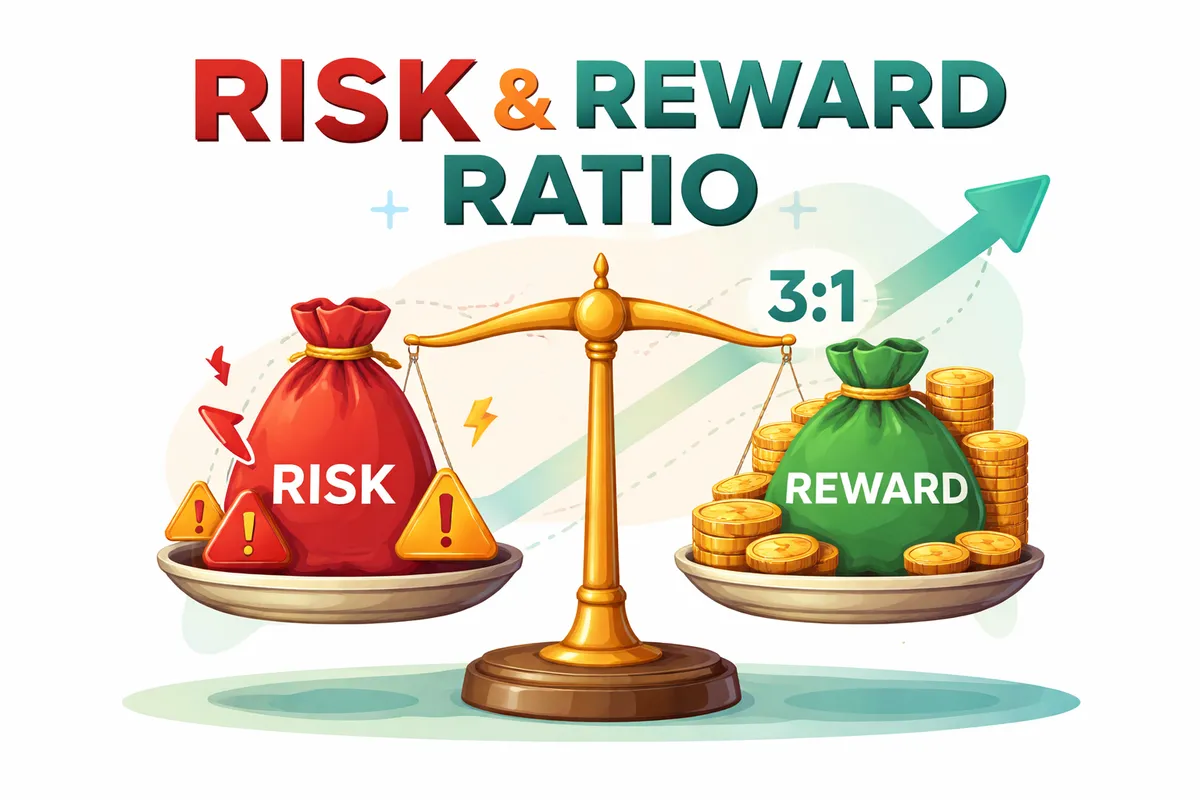
R multiple trading replaces one question with a better one. Instead of asking how much a trade made, you ask how much it made relative to what you put at risk.
Those answers can point in opposite directions. A $400 win on a $2,000 risk is a worse trade than a $150 win on a $50 risk. The dollar figures say otherwise, and that is exactly the problem.
What Is an R-Multiple?
An R-multiple expresses a trade’s result as a multiple of the money you risked when you opened it. R stands for risk.
Your R is fixed at entry. It is the distance between your entry price and your stop, multiplied by your position size. If you buy at $84,000 with a stop at $82,000 and you are sized so that the stop costs you $200, then your R is $200.
From there the arithmetic is simple. Close the trade for a $600 profit and you made 3R. Get stopped out and you lost 1R. Scratch out for a $100 profit and you made 0.5R.
Every trade you have ever taken can be converted this way. The unit works across position sizes, across assets, and across account balances.
Why Dollars Hide What R Reveals
Here is the practical difference. A trade log in dollars tells you which trades were biggest. A trade log in R tells you which decisions were best.
Those are not the same list. A large dollar win on an oversized position is not skill, it is exposure. A modest dollar win on a tight stop can be the highest quality trade in the book.
R also makes results comparable as your account grows. A $500 win means something different on a $5,000 account than on a $50,000 one. A 2R win means the same thing on both.
The same applies across assets. Comparing a Bitcoin trade against a Cardano trade in dollars tells you almost nothing. In R, they sit on the same scale.
Converting a Trade Log into R
The conversion is a single division, and it takes one pass through your history.
For each closed trade, take the profit or loss and divide it by the risk you had on at entry. Record that number and nothing else. You now have a list that might read 2.4, -1, -1, 0.3, 5.1, -0.8, 1.6.
That list is far more informative than the equivalent dollar column. You can see immediately that one trade delivered 5.1R while most losers cost the full 1R.
One caution. R only works if you actually defined your risk at entry. If you entered without a stop, there is no denominator and the trade cannot be converted. That gap in the log is itself worth noticing.
What Expectancy Looks Like in R
Average your R-multiples and you get expectancy per trade, expressed in risk units.
Take that list above. It sums to 6.6 across seven trades, giving roughly 0.94R per trade. That means each trade, on average, returned slightly less than the amount risked.
This number is the most useful single figure in a trade log. It tells you what to expect from the next trade, in the only unit that stays constant. Our post on expectancy covers the calculation and its limits in more depth.
Expectancy in R also makes position sizing a separate decision. Once you know a system returns 0.4R per trade, you can decide what R should be in dollars. The system’s quality and your risk appetite stop being tangled together.
Where R-Multiples Change Your Decisions
Comparing strategies. Two systems, different assets, different sizes. In R, you can rank them honestly.
Spotting outlier dependence. If your total comes mostly from one 8R trade, your edge is thinner than the headline suggests. Remove the outlier and re-check.
Judging your exits. Track the maximum R each trade reached before you closed it. Consistently exiting at 1R on trades that ran to 3R is a fixable problem, and you will only see it in R.
Controlling losses. Losers should cluster at -1R. Any loss beyond that means the stop failed, or you moved it. A log full of -1.6R losses is a discipline problem with a number attached.
The concept was popularised by trader and author Van Tharp, whose work on position sizing and expectancy built R-multiples into a full framework. Investopedia’s risk-reward overview is a useful companion if the planning side is new to you.
How to Apply R-Multiples in Arrow Algo
Arrow Algo’s visual block builder lets you define risk as a first-class part of the strategy, which is what makes R meaningful. No code is required.
Start with an ATR block feeding your stop distance. Volatility-scaled stops keep your R consistent in risk terms as market conditions change. A fixed percentage stop does not.
Set your take-profit as a multiple of that same distance using a multiply block. Targeting 2R or 3R directly, rather than a fixed price, keeps the relationship intact across every trade the strategy takes.
Wire the stop and the target from the same ATR value. This is the part traders skip. If your stop scales with volatility but your target does not, your R-multiples drift and the log stops being comparable.
Then backtest and read the results in R rather than dollars. Arrow Algo pulls historical candles directly from Binance, Coinbase and HyperLiquid, so the fills reflect the exchange’s own data. Check whether your losers cluster near -1R. If they do not, the stop logic needs work before anything else does.
What Are the Key Takeaways?
- An R-multiple expresses a trade’s result as a multiple of the risk taken at entry.
- R is fixed when you open the trade: stop distance multiplied by position size.
- Dollar results rank trades by size. R-multiples rank them by decision quality.
- Averaging your R-multiples gives expectancy per trade in a unit that stays constant.
- Losers should cluster at -1R. Anything worse points to a stop that failed or was moved.
- Tracking the maximum R a trade reached reveals whether your exits are leaving money behind.
- R-multiples only exist if risk is defined at entry, which makes them a discipline check as well as a metric.
Disclaimer: This content is for educational purposes only and does not constitute financial advice. Trading involves significant risk and you should only trade with capital you can afford to lose. Past performance is not indicative of future results. Always conduct your own research before making any trading decisions.
Ready to build your own automated trading strategies without writing a single line of code? Start for free at Arrow Algo and join thousands of traders who've made the switch to systematic trading.