
RSI Divergence Strategy: How to Build It in Arrow Algo
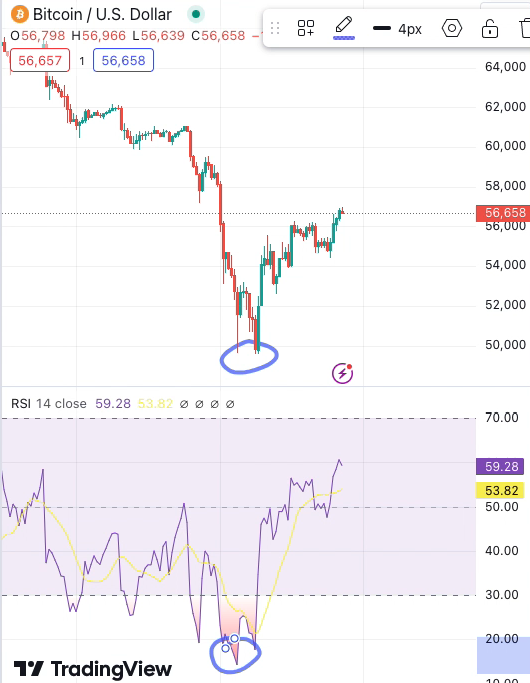
The RSI divergence strategy is one of the most widely searched reversal techniques in algorithmic trading. Where a standard RSI approach trades overbought and oversold readings in isolation, divergence adds a second layer — comparing RSI direction to price direction to identify moments when momentum is weakening before the trend actually turns. That early warning edge is what makes RSI divergence worth building as a standalone strategy.
What Is RSI Divergence?
RSI divergence occurs when the direction of the RSI line contradicts the direction of price. The RSI is measuring momentum — the rate at which price is moving — so when price continues in one direction but momentum begins moving the other way, it signals that the current move is losing its driving force.
There are two types. Bullish divergence forms when price makes a lower low but RSI makes a higher low. Momentum is improving even as price falls, suggesting sellers are exhausting themselves. Bearish divergence forms when price makes a higher high but RSI makes a lower high. Momentum is weakening even as price rises, suggesting buyers are losing conviction.
The core premise is that momentum tends to shift before price does. RSI divergence attempts to capture that leading signal rather than waiting for the reversal to be confirmed in price alone. For a detailed breakdown of RSI fundamentals, see our RSI complete guide.
Bullish vs Bearish RSI Divergence: What’s the Difference?
Bullish divergence identifies potential bottoms. When a market has been selling off, aggressive sellers start to exhaust their positions. This exhaustion often shows up first in the RSI, which begins printing higher lows even while price is still grinding lower. Identifying this pattern early allows a systematic strategy to position before the majority of the recovery move develops.
Bearish divergence identifies potential tops. When a rally is maturing, buyers start to thin out. Price may push higher on progressively weaker participation, which shows up as RSI failing to confirm the new price high. A systematic strategy can use this to exit longs or initiate shorts before the reversal materialises in price.
Both types are most reliable when they form at extended RSI levels — bullish divergence below 30, bearish divergence above 70 — rather than in the mid-range of the indicator.
How to Identify Valid Divergence Signals
Not every RSI discrepancy constitutes meaningful divergence. For a signal to carry weight:
- The two price reference points must be clearly defined swing highs or lows — not minor fluctuations within consolidation
- The RSI line must be clearly moving in the opposite direction to price — a flat RSI is not divergence
- Divergence at RSI extremes (below 30 for bullish, above 70 for bearish) produces more reliable signals than divergence in the middle of the RSI range
- Higher timeframes produce stronger signals — divergence on a 4-hour or daily chart tends to precede more significant moves than divergence on a 5-minute chart
A common mistake is acting on divergence the moment it is detected. Price confirmation — a break above a short-term resistance level, a bullish candle close, a momentum shift — should precede the actual entry.
What Are the Best RSI Divergence Trading Setups?
Standard reversal entry: Enter in the direction of the expected reversal once price confirms the divergence signal. For bullish divergence, this might be a close above the most recent short-term swing high after the second low is confirmed. The entry should not be on the divergence detection alone — wait for price to start moving before committing capital.
Divergence at structural support or resistance: The strongest divergence signals occur at meaningful price levels, not in open space. Bullish divergence at a tested support zone carries far more weight than divergence mid-range. Use prior swing lows, moving averages, or round numbers as confluence filters — only take the divergence signal if price is also at a structurally significant level.
Multi-timeframe divergence: When RSI divergence appears on two timeframes simultaneously at the same price area — for example, on both the 4-hour and 1-hour chart — the signal quality increases significantly. The higher timeframe defines the direction and importance; the lower timeframe provides the entry trigger with tighter risk management.
What Are the Limits of RSI Divergence?
RSI divergence signals that momentum has weakened. It does not predict the size or timing of the resulting move. A divergence signal can resolve with a brief pullback before the original trend resumes — not every divergence leads to a full trend reversal.
In strongly trending markets, bearish divergence can appear repeatedly without producing a meaningful sell-off. Price makes higher high after higher high while RSI prints progressively lower peaks for many candles. This is persistent divergence, and fading it in a strong trend is one of the most consistent ways to lose money with this strategy.
This is exactly why a confirmation step is non-negotiable. Divergence alone is a filter — it raises the probability of a turn but does not confirm one. The confirmation step (a structural break, a reversal candle, a momentum shift) is what converts a divergence observation into an actual entry signal.
How to Build an RSI Divergence Strategy in Arrow Algo
Arrow Algo’s visual builder includes the RSI block natively. Drag it onto the canvas, connect a Data Watcher (close price, your chosen pair and timeframe) to the RSI input, and set the period. Standard is 14, though shorter periods (9–11) increase sensitivity for faster-moving crypto markets.
To detect divergence, connect the RSI output alongside price data to a logic block that compares the current RSI swing low to the previous RSI swing low. Arrow Algo’s Min block can identify the lowest RSI value over a lookback period, and a comparison block checks whether the current minimum is higher than the prior minimum — the bullish divergence condition. Compare the same window in price simultaneously to confirm price is making a lower low.
Add a confirmation gate. Wire the divergence condition output into an AND block alongside a price-action confirmation (for example, close above the previous candle high). Only when both are true does the entry signal fire.
Set your stop-loss below the second low of the divergence pattern for bullish setups. Add a Position Status block to exit after a defined number of candles if the expected reversal has not materialised. Backtest across multiple market regimes — trending and ranging — to validate the signal quality before going live.
Key Takeaways
- RSI divergence occurs when RSI direction contradicts price direction — momentum weakening before a trend reversal.
- Bullish divergence (higher RSI low, lower price low) flags potential bottoms; bearish divergence (lower RSI high, higher price high) flags potential tops.
- Valid signals form at RSI extremes between clearly defined swing points — not in mid-range consolidation.
- Always require price confirmation before entering — divergence is a filter, not a trigger.
- Persistent divergence in strong trends is the most common pitfall; never fade divergence without structural confirmation.
- Multi-timeframe divergence and divergence at structural levels significantly improve signal quality.
- Arrow Algo’s visual builder lets you build RSI divergence logic, confirmation conditions, and position management without writing code.
Disclaimer: This content is for educational purposes only and does not constitute financial advice. Trading involves significant risk and you should only trade with capital you can afford to lose. Past performance is not indicative of future results. Always conduct your own research before making any trading decisions.
Ready to build your own automated trading strategies without writing a single line of code? Start for free at Arrow Algo and join thousands of traders who’ve made the switch to systematic trading.