
Solana Memecoin Trading: 1,411 Launches, Zero Edge
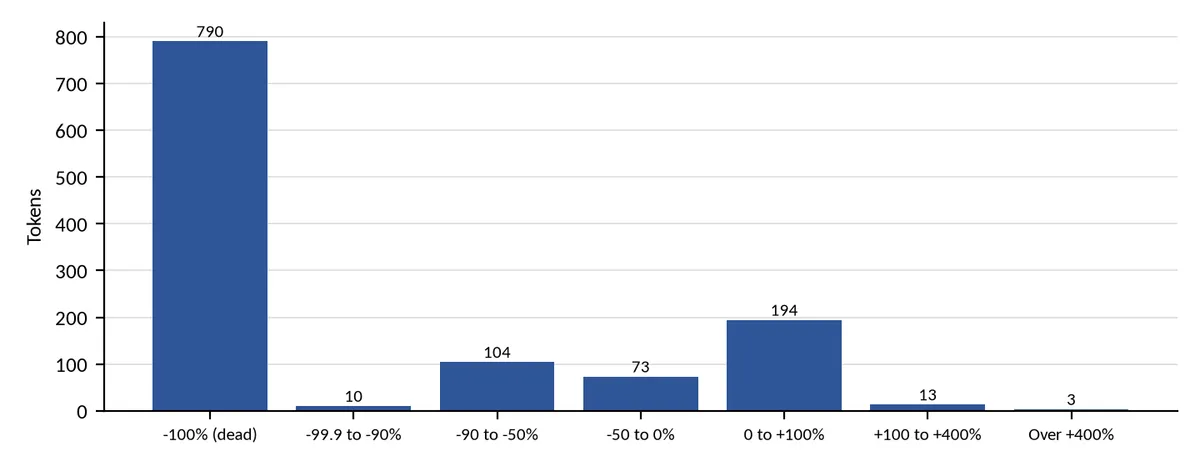
Solana memecoin trading has a reputation for turning $25 into $25,000 overnight. We wanted to know what an ordinary buyer actually earns. So we ran a forward paper-trading study. Over nine days in October 2026 we watched 91,657 new Solana pools appear. We bought every tradable one on paper, 30 minutes after launch, at realistic retail cost. Then we tested 416 other ways to trade the same tokens, machine-learning models that try to pick winners in advance, and a deep dive into the 143 tokens that actually reached 10x.
Every method lost money. Even the 10x tokens could not be picked out profitably before they moved. This post explains what we did, what we found, and why the lesson for anyone who builds trading rules points somewhere else entirely. The full study is available as a PDF with every table and confidence interval.
What Is Solana Memecoin Trading?
Solana memecoin trading means buying newly launched tokens on the Solana blockchain in the hope that one of them rises 10x or 100x before it collapses. Most launches come through launchpads such as pump.fun. Thousands appear every hour. Aggregator sites such as DexScreener list them with live price, liquidity and volume.
A typical buyer works from public data. They look at liquidity, holder counts, buy and sell counts, and safety flags from a service such as RugCheck. They may also look for hype on X. Then they buy a small amount and hope.
That is a rules-based process, whether the buyer thinks of it that way or not. So it can be tested like any other strategy. We tested it.
Why This Study Matters for Systematic Traders
Two reasons. First, memecoin launches are the purest lottery-ticket market in crypto. If any public-data rule works there, it is worth knowing. If none does, that is worth knowing too, because the same hours and the same capital could go into a market where rules can be tested properly.
Second, the study was built the way a careful algorithmic trader should build any test. The rules, costs and pass criteria were written down and hashed before the data was collected. The data was split by time into a development period and a held-out period. Every one of the 416 strategies was corrected for multiple testing. The honest answer is only possible because of that discipline.
How Did We Run the Experiment?
The lab ran from 17 to 26 October 2026. It never looked backwards. Every new pool seen on GeckoTerminal or Jupiter was enrolled. At 30 minutes of age, a decision was made. A token counted as tradable if it had at least $5,000 of liquidity and at least 20 transactions in the past hour. That gate left 1,411 tokens.
Each one was bought on paper for $25. The cost model charged 1.25% per leg in fees, 1% adverse slippage, constant-product price impact against the pool, and $0.10 per transaction. A 20-second latency was applied to every fill. Each token was then followed for 1, 6 and 24 hours. A token with liquidity under $500, or a price at 10% of entry or less, was scored as dead at -100%.
The 30-minute entry was deliberate. In the first minutes after launch, bots and insiders buy and sell to later arrivals. A public-data outsider cannot compete there. Waiting 30 minutes is what a careful retail buyer would do.
One Caveat Up Front
The collector ran on a machine that paused when idle. Only about 53 of the 215 hours in the window were observed, mostly on 18 to 20 October. The study describes a few days in one market regime. Every fill is simulated from snapshots taken 5 to 10 minutes apart, not from real trades.
We checked whether the gaps themselves could explain the loss. Scoring every token that was already dead before a gap as -100% made the result worse, not better. The confidence intervals are wide enough to absorb the coverage problem. They are still nowhere near zero.
What Happened to the 1,411 Tokens?
Buying everything lost at every horizon.
| Horizon | Tokens | Mean net return | 95% confidence interval | Median | Dead |
|---|---|---|---|---|---|
| 1 hour | 1,293 | -31.4% | -37.1% to -24.9% | -81.4% | 49% |
| 6 hours | 1,187 | -61.8% | -68.0% to -53.4% | -100% | 67% |
| 24 hours | 760 | -55.7% | -68.4% to -38.9% | -100% | 69% |
Two-thirds of tokens were dead within six hours. Only 16 of 1,187, or 1.3%, had doubled after costs. The best single trade returned over 3,700% at six hours. It did not matter. Remove the ten best trades and the six-hour mean falls to -68.1%.
In money terms, $25 on each of those 1,187 tokens is $29,675 staked. Six hours later, $18,349 of it was gone.
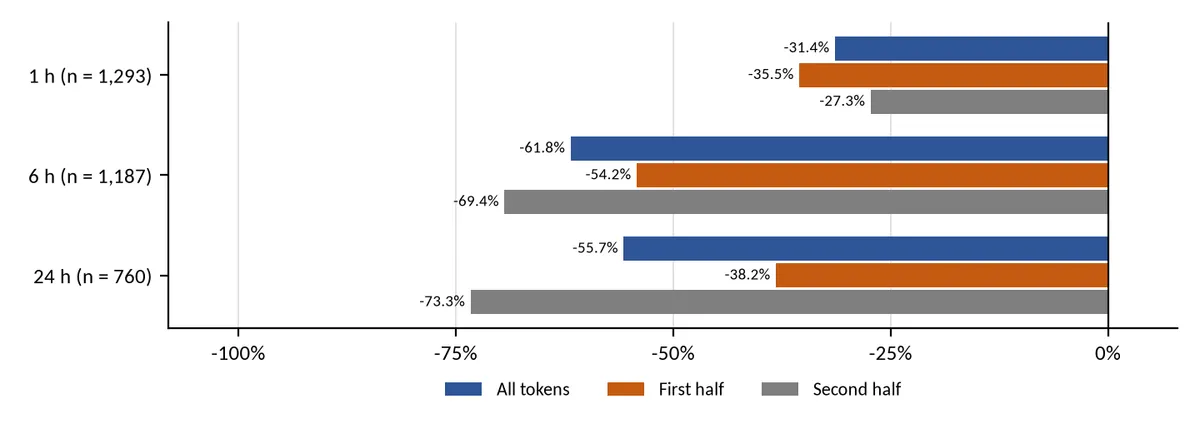
Both chronological halves of the study lost at every horizon. The result was not driven by one bad day.
It Was Not the Costs
A sceptic might blame the cost model. We removed it. With no fees, no slippage and no network cost of any kind, the six-hour mean was still -59.4%. Costs moved the answer by about two points. The tokens simply went to zero.
Removing likely honeypots made it worse, not better. A honeypot is a token that can be bought but not sold. Its price can only go up on paper. We found 144 of them inside the universe. Their fake gains were propping up the average. Without them the six-hour loss was -74.2%.
A Stop-Loss Helped Less Than It Looked
A rule exit with a +100% take-profit and a -35% stop lost a mean of 10.8%. That number is misleading. It rests on one token that jumped about 198 times between two five-minute snapshots. The jump happened while the pool’s liquidity drained from $37,000 to $10,000. Eight minutes later the liquidity was three cents. It was a price spike during a rug, and a real order would not have filled there. Without that one trade the mean was -25.8%.
This is the first lesson for any backtester. Always check the mean without the best trade.
Did Any Filter, Timing Rule or Exit Change the Answer?
No. Four pre-registered secondary studies all lost.
- A pump.fun launch filter that required a first-time creator and no bundled buys lost 44%. It did beat the rest of the launches, which lost 82%. Bad beat worse. Neither made money.
- Established tokens with an X sentiment check lost 39.6%.
- An on-chain rug check in place of RugCheck lost 27% with the rule exit and 64% with a fixed six-hour hold.
- Tokens promoted on X lost between 60% and 95% at six hours in every group. Explicit paid promotion marked the worst group.
Then we tested 416 alternative strategies on the same 1,411 tokens. Entry delays from 15 minutes to 24 hours. Holds from 15 minutes to 24 hours. A grid of take-profit and stop-loss levels. Trailing stops. Buy-the-dip rules. Momentum rules. Order-flow rules. Survivor rules that only bought tokens still alive after several hours. Entries at the moment a pump.fun token graduated to a real pool.
Not one of the 416 had a significantly positive mean, even before any correction. After a Bonferroni correction for all 400 strategies, 182 of the 311 with at least 30 trades were significantly negative. White’s reality check, which asks whether the best strategy found by searching beats zero once the search is accounted for, gave a p-value of 0.35. The best strategy on development data returned +85.2%. On the held-out period it lost 81.2%, with the whole confidence interval below zero.
The only cells that were not provably negative were entries about six hours after the decision. Their median return was -5.2%. That is exactly the cost of a round trip. By six hours, most surviving tokens no longer move. The buyer pays the fees and gets nothing. We call that no proven edge, not a proven loss. With about 300 trades, an edge smaller than 12.6% per trade could not have been detected either way.
Why Predicting the Winners Did Not Make Money
This is the most useful finding for anyone who likes machine learning.
We trained models on the first 44,234 tokens by time and tested them on the later 18,958, with no tuning on the test period. The models worked, in one sense. They could tell which tokens would move. On unseen tokens the gradient-boosting model reached an AUC of 0.87 for the top 10% of movers and 0.95 for tokens that doubled. The top 1% of its picks contained 36 to 40 times the base rate of doublers.
Then we bought the picks. The top 1% lost 59.4% at six hours. The doubler model’s top 1% lost 72.1%. Across 36 combinations of model, pick size and exit, every mean was negative. In 33 of the 36, the picks did worse than at least 99.9% of random selections of the same size.
The reason is simple once you see it. The features that predict a move are activity features: holders, buys, volume at 30 minutes. The tokens with the most activity are the ones most likely to spike. They are also the ones most likely to be dumped. The doubler model’s top picks had a six-hour dead rate of 65%, against 2.5% for all test tokens. Being able to predict which token will move is not the same as being able to profit from it.
The honeypot cluster made this worse. A buy-only token looks exactly like the activity the model learned to favour. Hundreds of buys an hour, zero sells, ever. RugCheck did not flag them. Only the trading record showed it.
What About the Real 10x Tokens?
We went back to the 143 tokens that genuinely reached 10x. All of them had observed sells, so they were real. We pulled one-minute candles, decoded the first on-chain trades after launch, and matched each winner with two look-alike tokens that did not make it.
The picture was clear. At 10 minutes of age, about 38 losers looked like each winner on every public measure. Standard indicators such as RSI, MACD, VWAP, Bollinger Bands and OBV could not separate future winners from look-alikes before about 15 minutes. By 30 minutes they mostly described a move already under way. The median 10x token peaked 86 minutes after launch and stayed near its high for about five to seven minutes. At 30 minutes, only 51 of 59,007 tokens still had a 10x ahead of them.
The best rule we could find in hindsight picked 10x tokens at 13.6% precision on held-out data. Its profit was not proven. And the largest paper gains sat with the creator, bundlers and snipers who bought in the first 15 seconds. Those are not seats an outsider can take.
Where Should That Energy Go Instead?
Step back from the numbers and the shape of the problem is obvious. In a memecoin launch, the information that decides the outcome is who holds the supply and when they will sell. That is not in any public feed at 30 minutes. A trader working from price, volume and holder counts is reading the shadow of a decision somebody else has already made. No rule, filter, exit or model can fix that, because the input is missing.
Compare that with building a rule on Bitcoin, Ethereum or any established pair on a major exchange. The order book is deep. Fees are a fraction of a percent, not 5% a round trip. Years of candle history exist, so a rule can be tested across bull markets, bear markets and ranges. The same rule can be checked on a held-out period, then walked forward, then run on paper before any capital is at risk. If it fails, you find out for free. If it survives, you know exactly what it did and why.
None of that guarantees profit. Most rules fail testing on established markets too. The difference is that testing works there. You can reject bad ideas before they cost money, and you can tell a good result from a lucky one. The memecoin market denies you both. In our data, even a buyer with perfect foresight of every token’s peak lost 4.8% buying everything, because 84% of tokens never rose at all.
Somebody is making money, of course. DefiLlama’s fee tracker shows pump.fun alone collecting about $30 million a month in fees on average over the past year, and about $1.3 billion since it launched. October 2026 is on course to be its biggest month of the year. That revenue is not coming from institutions. It comes from the same launches where the average buyer in our study was down 62% six hours later. The launchpad gets paid whether the token lives or dies. The buyer does not.
The habits that produced our result, pre-registration, held-out testing, multiple-testing correction and best-trade checks, are the same habits that separate a tested strategy from a hunch. They just need a market where they have something to work with.
How to Apply These Lessons in Arrow Algo
Arrow Algo’s backtester runs on exchange data for listed pairs on Binance, Coinbase, HyperLiquid and others. That is the environment the lessons above were made for.
Build your entry and exit rules with visual blocks. Set the fee and slippage assumptions before you run anything, and keep them fixed. Run the backtest, then run a walk-forward test so the rules are judged on candles they never saw. Open the trade list and look at the best trade. If the result depends on it, you do not have a strategy. Our in-sample vs out-of-sample testing guide covers the split in detail.
If you want a filter, test it against the unfiltered baseline, the way the pump.fun creator filter was tested against all launches. A filter that loses less is not a filter that wins. And when a result looks too good, remember survivorship bias. The 10x stories are real. They are also the 143 out of 67,734.
The user decides whether to deploy a tested strategy. If they do, the rules send buy and sell signals to the user’s own exchange account. The exchange decides whether to accept and execute each order. No code is needed at any step.
What Are the Key Takeaways?
- Solana memecoin trading from public data, entering 30 minutes after launch, lost 62% at six hours across 1,411 tokens. Every confidence interval was far below zero.
- The loss was not a cost artefact, a dead-token artefact or a data-gap artefact. With no costs at all it was still 59%.
- No filter, delay, exit rule or trailing stop among 416 tested was significantly profitable. The best in hindsight lost 81% out of sample.
- Models predicted which tokens would move with high accuracy, and buying their picks lost 25% to 72%. Even the 143 real 10x tokens had 38 look-alike losers each at 10 minutes.
- Honeypots inflated every winner group. Check sellability, not just price.
- The launchpad is the reliable winner: pump.fun takes about $30 million a month in fees from these launches.
- The information that decides a memecoin’s fate is not public. On established markets, the data exists and the tests work. Spend your testing discipline where it can pay off.
Disclaimer: This content is for educational purposes only and does not constitute financial advice. Trading involves significant risk and you should only trade with capital you can afford to lose. Past performance is not indicative of future results. Always conduct your own research before making any trading decisions.
Ready to build your own automated trading strategies without writing a single line of code? Start for free at Arrow Algo and join thousands of traders who've made the switch to systematic trading.