
Stochastic Divergence Strategy: How to Build It in Arrow Algo
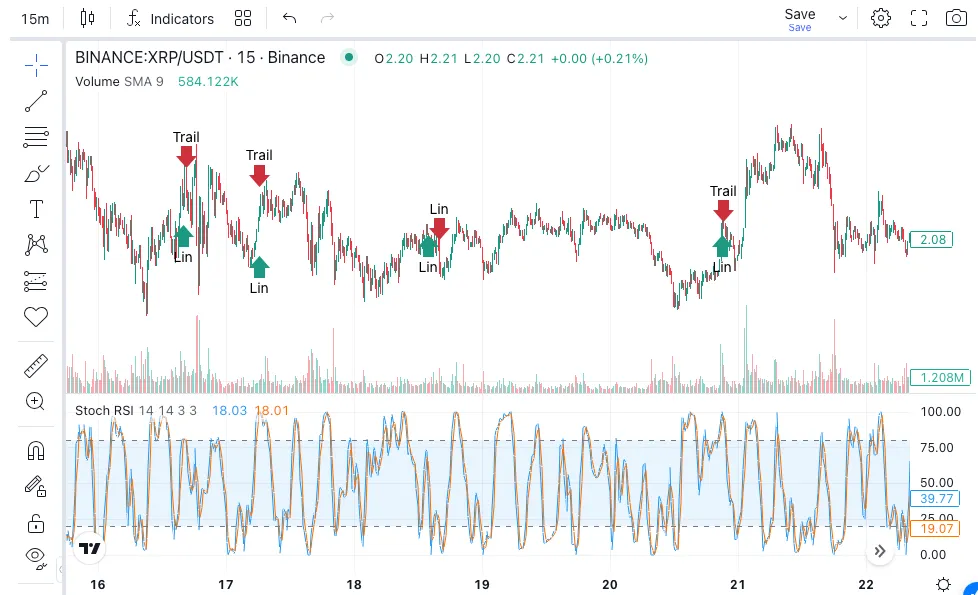
The stochastic divergence strategy takes the stochastic oscillator beyond its standard overbought/oversold role. Instead of entering when the oscillator reaches an extreme zone, divergence trading enters when the relationship between price and the oscillator breaks down — when price makes a new extreme but the stochastic fails to confirm it. That failure is a leading signal of momentum decay, often appearing before price reverses.
What Is Stochastic Divergence?
Divergence occurs when price and the stochastic oscillator move in opposite directions. Price makes a new high, but the stochastic makes a lower high on the same move — bearish divergence. Or price makes a new low, but the stochastic makes a higher low — bullish divergence. The oscillator is telling you that the momentum driving the price extreme is weakening, even though price has not yet confirmed the reversal.
The key distinction from a basic overbought/oversold signal: divergence does not require the oscillator to be in an extreme zone to be valid. A divergence forming at the 70 level is a legitimate signal if price is making a new high and the oscillator is not. The oscillator level matters less than the directional relationship between price and the oscillator peaks or troughs.
Regular Divergence vs Hidden Divergence
There are two types of stochastic divergence with different trading implications.
Regular divergence signals a potential trend reversal. Bearish regular divergence: price makes a higher high, stochastic makes a lower high. The uptrend is losing momentum — expect a reversal or pullback. Bullish regular divergence: price makes a lower low, stochastic makes a higher low. The downtrend is losing momentum — expect a bounce or reversal. Regular divergence is the higher-probability signal in ranging or topping/bottoming markets.
Hidden divergence signals a trend continuation. Bullish hidden divergence: price makes a higher low (uptrend intact), but the stochastic makes a lower low — the oscillator pulled back more than price, signalling the trend is stronger than the oscillator suggests. Bearish hidden divergence: price makes a lower high (downtrend intact), stochastic makes a higher high. Hidden divergence is the continuation signal — it fires when a trend is pausing rather than reversing, confirming that the primary direction remains valid.
How to Spot a Valid Stochastic Divergence Signal
Not every divergence is tradeable. Three conditions must hold for the signal to be meaningful.
Two confirmed swing points: Both the price swing and the oscillator swing must be fully formed — both peaks or both troughs must be identifiable with confirmed candles on both sides. Anticipating a divergence before the second swing point is confirmed produces premature entries into still-moving trends.
The swings must be separated by enough bars: A divergence between swings that are only 3–4 bars apart is noise. The minimum separation that produces a meaningful divergence is typically 8–10 bars on the trading timeframe. Wider separation produces more reliable signals.
The price swing must be at a structural level: Divergence at a prior swing high, resistance zone, or major moving average is more actionable than divergence in the middle of open price space. Structural confluence raises the probability that the divergence represents a genuine turning point rather than mid-range noise.
Entry, Stop, and Target Rules
Enter on the candle following the completion of the divergence pattern — when the second swing point is confirmed and the stochastic begins to turn. Do not enter mid-formation.
For bearish regular divergence entries: sell when the second oscillator peak is confirmed and %K begins rolling over. Place the stop above the most recent price high — the swing that created the divergence. If price takes out that high after entry, the bearish divergence thesis is invalidated.
For bullish regular divergence entries: buy when the second oscillator trough is confirmed and %K begins turning up. Stop goes below the most recent price low.
Target the prior swing in the opposite direction as the first take-profit level. Trail a portion of the position if the move extends. Divergence signals can produce sharp reversals — the initial target is conservative, and trailing captures additional upside on strong reversals.
Why Divergence Signals Fail
Divergence in a strong trend: In a powerful trending market, bearish divergence can appear repeatedly as price makes successive new highs while the oscillator posts progressively lower highs. Each signal appears valid. Each entry loses. The oscillator is reflecting that momentum is less extreme than the initial impulse — but the trend continues regardless. Always check ADX: divergence signals in high-ADX environments (above 25) are lower probability. Strong trends can sustain divergence for extended periods.
Missing the second swing confirmation: Entering on a suspected divergence before the second oscillator swing is fully formed means entering while the trend is still potentially intact. Wait for the second swing point to be confirmed by at least one closed candle on both sides before treating the pattern as valid.
Ignoring timeframe alignment: A bearish divergence on a 15-minute chart carries far less weight than one on a 4-hour chart. Higher-timeframe divergences produce stronger and more sustained reversals. Where possible, confirm that the divergence on your trading timeframe aligns with the trend structure on the next-higher timeframe.
How to Build This Strategy in Arrow Algo
Arrow Algo’s no-code builder lets you construct the divergence detection logic using visual blocks.
Add a Stochastic block and connect it to your price data. Use a Max block set to a lookback period (e.g. 20 bars) on both the %K output and the close price — this identifies the recent peak in both. Add a comparison condition: if the current %K peak is lower than the previous %K peak while the current price peak is higher than the previous price peak, the bearish divergence condition is met.
Mirror the logic for bullish divergence using Min blocks instead of Max — looking for a higher %K trough alongside a lower price trough. Wire both conditions to your entry blocks with appropriate direction.
Connect the ADX block and add a filter condition: only allow divergence entries when ADX is below 25 to avoid fighting strong trends. Backtest the strategy across both ranging and trending periods in Arrow Algo to verify that the ADX filter is suppressing the right environment. Compare win rate by session type to confirm the filter is working as intended.
What Are the Key Takeaways?
- Stochastic divergence signals momentum decay before price reverses — entering earlier than a standard overbought/oversold crossover
- Regular divergence signals reversals; hidden divergence signals trend continuation — understand which type you are trading before entering
- Both swing points must be fully confirmed before entering — never enter on a suspected divergence that is still forming
- The stop goes beyond the price swing that created the divergence — if that level breaks, the thesis is invalid
- Avoid divergence signals when ADX is above 25 — strong trends can sustain divergence for multiple bars without reversing
- Arrow Algo’s Max, Min, Stochastic, and ADX blocks let you build the full divergence detection and entry logic without code
Disclaimer: This content is for educational purposes only and does not constitute financial advice. Trading involves significant risk and you should only trade with capital you can afford to lose. Past performance is not indicative of future results. Always conduct your own research before making any trading decisions.
Ready to build your own automated trading strategies without writing a single line of code? Start for free at Arrow Algo and join thousands of traders who’ve made the switch to systematic trading.