
StochRSI Trading Strategy: How to Build It in Arrow Algo
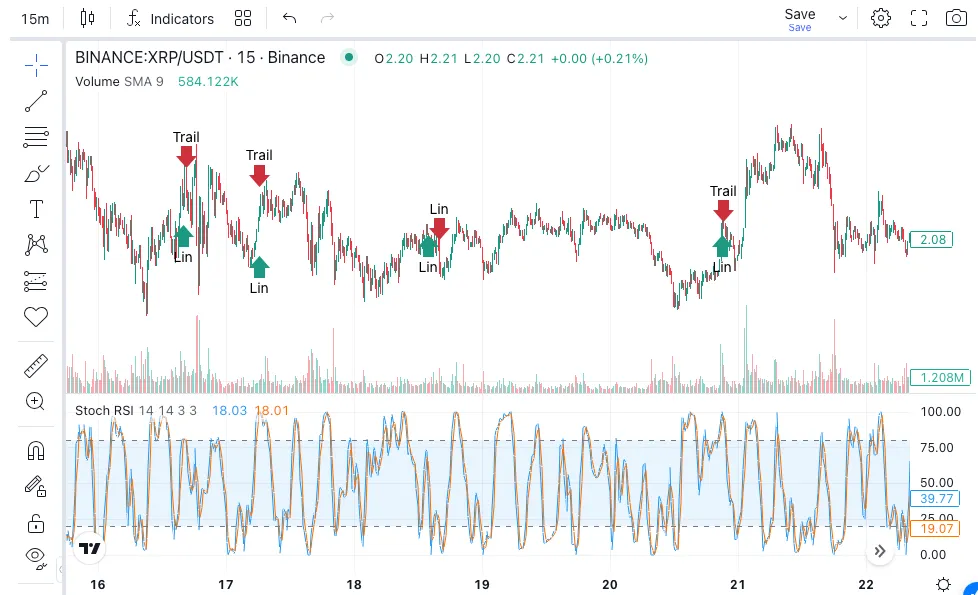
The StochRSI trading strategy applies the stochastic formula to RSI values rather than to price. The result is an oscillator that is more responsive than RSI alone — detecting overbought and oversold conditions earlier, generating crossover signals faster, and cycling through extremes more frequently. For systematic traders who find RSI too slow or stochastic too noisy, StochRSI offers a middle path that combines the momentum sensitivity of RSI with the oscillator mechanics of the stochastic.
What Does StochRSI Measure?
StochRSI takes the RSI value over a defined period and asks: where does the current RSI reading sit within the range of RSI values over that same period? If RSI has ranged between 30 and 70 over the past 14 bars and the current RSI is 68, StochRSI will be near 1.0 — close to the top of its recent RSI range. If RSI is at 32, StochRSI will be near 0.0 — close to the bottom.
The output is two lines — %K (the raw StochRSI) and %D (a smoothed average of %K) — both running between 0 and 1 (or 0 and 100 in some implementations). A reading above 0.8 is overbought. Below 0.2 is oversold. These thresholds fire more frequently than standard RSI’s 70/30 levels because StochRSI measures momentum of momentum, not momentum of price.
How StochRSI Differs from RSI and Stochastic
RSI measures the speed and magnitude of price changes over a period. It is slow to reach extremes in trending markets and can stay overbought or oversold for extended periods. StochRSI normalises RSI’s output — so even a mildly elevated RSI will register as near-overbought on StochRSI if RSI has been in a low range recently.
The standard stochastic oscillator measures where the current close sits within the price high-low range. It responds to price extremes directly. StochRSI responds to RSI extremes — one layer of abstraction removed from price. This makes it more sensitive to short-term momentum shifts but also more prone to whipsaw in choppy markets. The choice between stochastic and StochRSI comes down to timeframe: StochRSI suits shorter-timeframe momentum entries; stochastic suits swing and daily entries where you want a slower filter.
The Core StochRSI Trading Approach
The primary entry signal is the %K/%D crossover in an extreme zone. When both %K and %D are below 0.2 and %K crosses above %D, the oscillator is reversing from oversold territory — a long signal. When both are above 0.8 and %K crosses below %D, the oscillator is reversing from overbought — a short signal.
The signal fires earlier than a standard RSI crossover at 30/70 because StochRSI reaches its extremes faster. This gives you more entries per time period — but also more false entries. The quality filter is critical. Two approaches work well.
Trend-filtered approach: Only take long signals when price is above a 200-period EMA (the long-term trend is up). Only take short signals when price is below it. This converts StochRSI from a pure oscillator into a trend-aligned momentum entry tool — using the oscillator to time entries in the direction of the prevailing trend rather than fading extremes.
Dual-timeframe confirmation: Take StochRSI signals on your trading timeframe only when the higher timeframe StochRSI is not in the opposite extreme. If the 4-hour StochRSI is overbought while the 1-hour generates a long signal, the higher-timeframe context overrides — skip the entry.
Stop and Target Rules
For overbought/oversold reversion entries: place stops beyond the recent swing high (short entries) or swing low (long entries). A move through that level while StochRSI is in the extreme zone means the momentum extreme is extending rather than reversing.
Take profit when StochRSI returns to the 0.5 midpoint. At 0.5, the RSI is in the middle of its recent range — the short-term momentum imbalance has been resolved. Trail a portion of the position if the momentum extreme was large and the move is strong. On trend-filtered entries (long above 200 EMA), consider holding to the next resistance level rather than exiting at the 0.5 target — the trend gives additional room.
Common Mistakes with StochRSI
Treating every extreme as a reversal signal: StochRSI reaches overbought and oversold more frequently than RSI. In a strong trend, it may cycle through overbought readings repeatedly without a reversal occurring. Always check whether you are in a trending or ranging market before taking a reversion entry.
Using the default period without testing: The default 14-period StochRSI on daily charts produces a different signal frequency than 14-period on a 15-minute chart. On shorter timeframes, the signal is extremely fast — sometimes too fast to execute. Experiment with longer periods (21 or 28) on shorter timeframes to reduce the signal noise.
Ignoring the %D line: Some traders use only the %K line and treat any move above 0.8 or below 0.2 as a signal. Using both %K and %D — waiting for the crossover — significantly reduces false entries and improves the timing of the actual entry within the extreme zone.
Building a StochRSI Strategy in Arrow Algo
Arrow Algo’s no-code builder includes the StochRSI block, which outputs both %K and %D directly. Add it to your canvas and connect your close price and Data Watcher. Set the RSI period and stochastic smoothing to match your chosen timeframe.
Add two condition blocks: one checking %K above 0.8 AND %D above 0.8 (overbought zone), one checking %K below 0.2 AND %D below 0.2 (oversold zone). Connect a Crossover block to the %K and %D outputs to detect the directional cross. Wire the crossover and the zone condition together as an AND gate — entry fires only when both conditions are true simultaneously.
For the trend filter, add an EMA block (period 200) and a condition checking whether current price is above or below the EMA. Wire this as a third AND gate input: long entries fire only above the EMA, short entries only below. Backtest across a range of market conditions to confirm the trend filter is improving win rate, not just reducing trade count.
What Are the Key Takeaways?
- StochRSI applies the stochastic formula to RSI values — producing a faster oscillator that reaches overbought/oversold extremes more frequently than either indicator alone
- The primary signal is a %K/%D crossover while both lines are in the overbought (above 0.8) or oversold (below 0.2) zone
- A trend filter (200 EMA) converts StochRSI from a reversion tool to a trend-aligned momentum entry — taking signals only in the direction of the prevailing trend
- Take profit when StochRSI returns to 0.5; stop goes beyond the swing point that would invalidate the reversal
- Avoid using only %K — wait for %K/%D crossover to time entries within the extreme zone and reduce false signals
- Arrow Algo’s StochRSI block outputs both %K and %D directly — connect to Crossover, condition, and EMA blocks to build the full filtered strategy without code
Disclaimer: This content is for educational purposes only and does not constitute financial advice. Trading involves significant risk and you should only trade with capital you can afford to lose. Past performance is not indicative of future results. Always conduct your own research before making any trading decisions.
Ready to build your own automated trading strategies without writing a single line of code? Start for free at Arrow Algo and join thousands of traders who’ve made the switch to systematic trading.