
Transaction Cost Modelling: Build Realistic Backtests That Hold Up
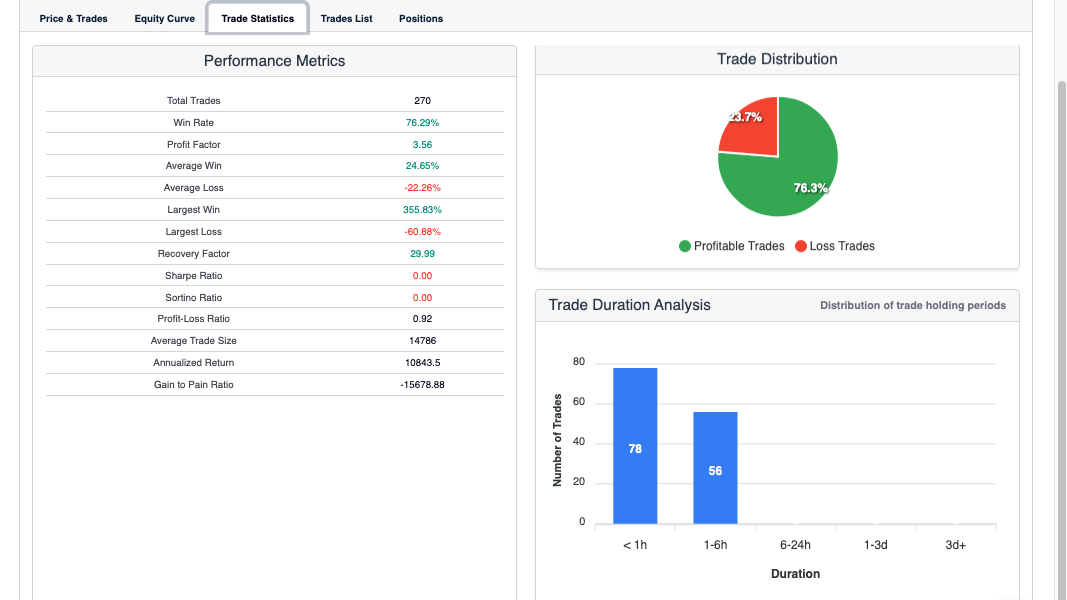
Transaction cost modelling is the practice of building realistic estimates of trading expenses — spreads, commissions, and slippage — directly into a strategy’s backtest before evaluating its performance. Without this step, a backtest measures an ideal version of a strategy that cannot exist in live markets. The result is a gap between what the backtest shows and what actually happens when real orders hit a real exchange.
What Is Transaction Cost Modelling?
Transaction cost modelling is the process of quantifying and incorporating all the costs associated with executing a trade into a strategy’s performance calculations. A basic backtest assumes trades execute at the exact price shown on a chart. In practice, every trade incurs three cost layers. These are the bid-ask spread, the commission charged by the exchange, and slippage — the difference between the intended price and the actual fill. Transaction cost modelling builds all three into the strategy’s P&L from the start.
The Real Cost of a Trade
Most traders think about commissions first — but the spread and slippage are often larger contributors to total transaction cost, especially on lower-liquidity pairs or larger position sizes.
Bid-ask spread: Every market has a buyer price (bid) and a seller price (ask). The difference is the spread. A market order fills at the ask when buying and the bid when selling. On liquid pairs like BTCUSDT the spread is typically small — fractions of a dollar. On lower-liquidity altcoins, spreads can be 0.1–0.5% or wider.
Commission: Exchange trading fees typically range from 0.02% to 0.10% per side for spot and perpetual markets, depending on the exchange and maker/taker status. A 0.05% taker fee on both entry and exit means 0.10% of notional value consumed before the strategy captures any profit. On a strategy targeting 0.5% moves, that is 20% of gross profit consumed by fees alone.
Slippage: When a market order executes, it moves through the order book. Larger orders consume more liquidity and fill at progressively worse prices. Slippage typically ranges from a few basis points on liquid markets to 0.1–0.5% on thinner ones. Fast-moving markets amplify slippage further. See our post on slippage and transaction costs for a deeper treatment of execution dynamics.
How Commission Structures Affect Strategy Performance
The impact of transaction costs is not linear — it scales with trade frequency. A strategy that trades once a week at 0.10% round-trip costs incurs roughly 5% of capital per year in fees. A strategy that trades five times per day at the same rate incurs over 250% per year. High-frequency approaches that look compelling before costs often become loss-making once realistic fees are included.
This is why transaction cost modelling matters most for short-term strategies targeting small moves. A scalping strategy targeting 0.3% profit per trade with 0.10% round-trip costs needs the trade to succeed more than a third of the time just to cover fees. That is before accounting for spread or slippage. A longer-term swing strategy targeting 3% per trade is far less sensitive to the same cost structure.
The ratio to monitor is cost-to-target: what percentage of your target profit per trade is consumed by transaction costs? Above 20–25%, the strategy’s edge needs to be unusually strong to survive live execution. This connects directly to the problem of data snooping bias. A backtest that ignores costs is already fitting to noise before the first parameter is touched.
How to Build Realistic Cost Assumptions
Use taker fees, not maker fees: Assume taker fees unless your strategy explicitly places limit orders that rest in the order book and you have confirmed they fill as makers. Most algorithmic strategies using market or stop-market orders pay taker rates. Using the lower maker rate in a backtest while executing at taker rates in live trading is a systematic error.
Add a fixed slippage estimate per trade: For liquid large-cap pairs like BTC and ETH on major exchanges, 0.02–0.05% per trade is a reasonable conservative starting estimate for a normal-size retail position. For smaller altcoins or larger position sizes, use 0.1–0.2%. Test with multiple assumptions to understand how sensitive the strategy is to this input.
Include both sides: Apply transaction costs to both entry and exit. A common mistake is including entry costs only. Every closed trade incurs two sets of costs — both must be subtracted from the trade’s gross P&L.
Stress-test your assumptions: Run the backtest three times at different cost levels. Optimistic uses tight spreads and maker fees. Realistic uses taker fees plus moderate slippage. Conservative uses taker fees plus high slippage. A robust strategy survives all three. A strategy that only passes the optimistic scenario is fragile — it depends on execution conditions that may not materialise live.
How to Apply Transaction Cost Modelling in Arrow Algo
Arrow Algo’s backtesting engine lets you configure fee and slippage assumptions before running any test — all through the settings panel, without code.
Set the commission rate to match the exchange and fee tier you intend to trade on. Enter a slippage estimate appropriate for your target asset and position size. Arrow Algo applies these costs to every simulated trade automatically — both entry and exit — and subtracts them from the strategy’s reported P&L.
Once the base backtest is complete, run the same strategy two more times with different cost inputs: once with lower costs and once with higher costs. Compare the equity curves and total returns across all three runs. If performance degrades significantly between optimistic and conservative assumptions, the strategy’s edge depends on execution quality rather than signal quality. That is a risk worth understanding before going live.
This stress-test approach takes minutes to run in Arrow Algo’s drag-and-drop interface and produces a far more honest picture of what the strategy can realistically achieve.
What Are the Key Takeaways?
- Transaction cost modelling builds spread, commission, and slippage estimates into a backtest before evaluating any performance metric
- The three cost layers — spread, commission, slippage — are all guaranteed; ignoring any one of them overstates expected returns
- Cost impact scales with trade frequency: high-frequency strategies are far more sensitive to per-trade costs than swing strategies
- Use taker fees, include both entry and exit costs, and add a slippage estimate for every trade
- Stress-test with optimistic, realistic, and conservative cost assumptions — a robust strategy survives all three
- Arrow Algo’s backtester lets you configure fee and slippage inputs directly, applying them automatically to every simulated trade
Disclaimer: This content is for educational purposes only and does not constitute financial advice. Trading involves significant risk and you should only trade with capital you can afford to lose. Past performance is not indicative of future results. Always conduct your own research before making any trading decisions.
Ready to build your own automated trading strategies without writing a single line of code? Start for free at Arrow Algo and join thousands of traders who’ve made the switch to systematic trading.