
Volume Profile (pseudoVPVR): Complete Guide for Algorithmic Trading
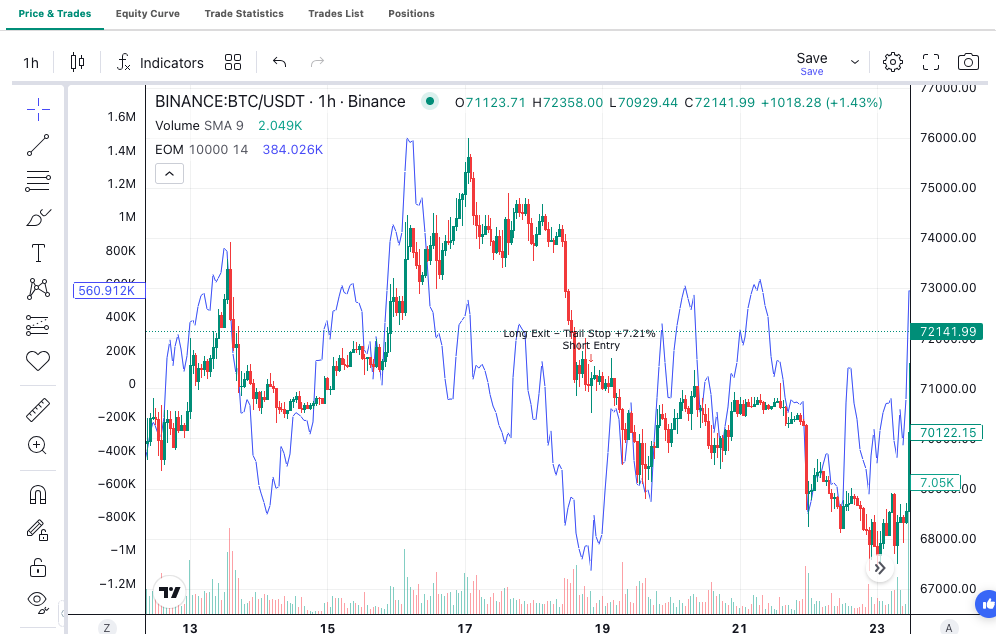
Volume Profile maps where trading actually happened — not just when. Rather than plotting volume against time on a horizontal bar below the chart, the Volume Profile (pseudoVPVR) in Arrow Algo distributes volume vertically across price levels, revealing which price zones attracted the most activity and which ones the market barely touched. For algorithmic traders, this creates a structural view of the market that price action alone cannot provide: a map of where participants genuinely engaged, and where they did not.
What Is the Volume Profile?
A Volume Profile displays the total trading volume executed at each price level over a defined period. Arrow Algo implements this as the pseudoVPVR (pseudo Volume Profile Visible Range) — a constructed approximation built from candle-level volume data available from the exchange. The “pseudo” designation reflects that true tick-by-tick volume data across all market participants rarely exists in crypto, so the indicator uses available candle volume as its input.
The Volume Profile produces several key reference points:
- Point of Control (POC): The single price level with the highest traded volume over the period. The POC acts as a magnetic level — price frequently returns to it.
- High Volume Node (HVN): A price zone where significant volume traded. HVNs tend to act as support and resistance areas, and price often consolidates around them.
- Low Volume Node (LVN): A price zone where little volume traded. Price moves through LVNs quickly — they represent areas of low participation and minimal price memory.
- Value Area: The price range containing approximately 70% of the total volume for the period. The top and bottom of this range (VAH and VAL) serve as key reference levels.
What Does the Volume Profile Measure?
The Volume Profile measures market acceptance and rejection at specific price levels. A price level with high volume tells you that buyers and sellers reached an agreement there in significant size — the market accepted that price. A price level with low volume tells you that participants moved through quickly without establishing meaningful positions — the market rejected that price.
This is fundamentally different from what most price-based indicators measure. A moving average tells you where price was. The Volume Profile tells you where the market spent time and committed capital — a more direct measure of structural significance.
In crypto markets, the pseudoVPVR is particularly useful because volume concentrations shift clearly around key events — exchange listings, regulatory announcements, or macro shocks. These volume footprints persist on the chart and provide context for future price behaviour long after the triggering event has passed.
How to Read Volume Profile Signals
Reading the Volume Profile involves identifying the key zones and interpreting their role in current price action:
- Price above the POC: The market trades above the dominant volume level. This is broadly bullish — the majority of historical volume sits below current price, suggesting buyers are in control of the range.
- Price below the POC: The market trades below the dominant volume zone. This puts sellers in structural control of the range.
- Price entering an HVN: Expect slowing momentum and consolidation. Significant historical volume at this level means both sides have strong conviction — it takes effort to push through.
- Price entering an LVN: Expect faster, more directional movement. Low volume means no one defended this level before, so price tends to move through it with less friction.
- Price returning to the Value Area: Moves back into the Value Area (the 70% zone) often indicate mean-reversion behaviour. Breakouts above VAH or below VAL require conviction to sustain.
What Are the Best Volume Profile Trading Strategies?
POC reversion: After price moves away from the Point of Control, it frequently revisits the POC before continuing. A systematic strategy can enter near the POC when price retraces to it during a trend, using it as a support or resistance level with volume-backed significance.
HVN support and resistance: Use High Volume Nodes as structural levels for entries and exits. When price approaches an HVN from below during an uptrend, treat the HVN as potential resistance. When price holds an HVN as support during a pullback, it signals the trend retains strength. Combining HVN levels with Order Blocks or Fair Value Gaps creates multi-confluent entry logic.
LVN gap-fill speed strategy: When price enters a Low Volume Node, the path of least resistance suggests a fast directional move to the next HVN or the Value Area boundary. Systematic strategies can use LVN zones as momentum filters — taking entries in the direction of the break and targeting the next volume-dense level as the profit objective.
What Are Common Volume Profile Mistakes?
- Using too short a lookback: A Volume Profile built on three days of data produces different levels than one built on three months. Match the lookback period to your strategy’s timeframe. Short-term traders use session profiles; position traders use longer-term profiles.
- Treating the POC as a guaranteed reversal level: The POC is a high-probability reference, not a guaranteed reversal. Price can blow through it with sufficient momentum. Always require a confirmation signal at the POC rather than entering blindly on touch.
- Ignoring the broader trend: An HVN resistance in an uptrend carries far less weight than one at a major structural peak. Read Volume Profile levels in the context of the dominant trend direction.
- Updating the profile incorrectly: A Volume Profile represents a specific period. When market structure shifts significantly, the relevant profile needs updating. Using a stale profile from a prior market regime produces misleading levels.
- Over-relying on pseudoVPVR in thin markets: Because the pseudoVPVR uses candle volume data rather than true tick data, its accuracy declines in very thin or illiquid markets. Apply it primarily to liquid pairs with consistent volume.
How to Build Volume Profile Strategies in Arrow Algo
Arrow Algo’s visual block builder includes the pseudoVPVR block, which calculates and outputs Volume Profile reference levels — including the POC, HVN zones, and LVN areas — for any pair and timeframe. You connect these outputs directly to your entry, exit, and filter blocks without writing any code.
A POC reversion strategy in Arrow Algo’s drag-and-drop canvas:
- Add the pseudoVPVR block to your canvas and select your lookback period and timeframe.
- Connect the POC output to a condition block that fires when price retraces to within a defined distance of the POC.
- Apply a trend direction filter — for example, only take long entries at the POC if price is above a long-period EMA. This keeps the reversion trade trend-aligned.
- Set a take-profit at the next HVN above the POC, and a stop-loss below the POC (or below the nearest LVN).
- Run a backtest across multiple market conditions to validate the POC-reversion edge before deploying it live.
For a broader context on using volume-based tools alongside price structure indicators, see our guide on order flow trading.
What Are the Key Takeaways?
- Volume Profile maps traded volume across price levels, showing where the market committed capital — not just when it moved.
- The Point of Control (POC) is the price level with the highest volume for the period and acts as a powerful magnetic reference.
- High Volume Nodes (HVNs) slow price down; Low Volume Nodes (LVNs) let price move fast.
- The Value Area contains approximately 70% of volume — breakouts above or below it require conviction to sustain.
- Arrow Algo’s pseudoVPVR uses available candle volume to construct an approximation of full volume profile — well-suited to liquid crypto pairs.
- Match the lookback period to your strategy’s timeframe and confirm POC signals before entering.
- Arrow Algo’s pseudoVPVR block outputs key levels directly into your visual strategy canvas with no coding required.
Disclaimer: This content is for educational purposes only and does not constitute financial advice. Trading involves significant risk and you should only trade with capital you can afford to lose. Past performance is not indicative of future results. Always conduct your own research before making any trading decisions.
Ready to build your own automated trading strategies without writing a single line of code? Start for free at Arrow Algo and join thousands of traders who’ve made the switch to systematic trading.