
Vortex Indicator Trading Strategy: How to Build It in Arrow Algo
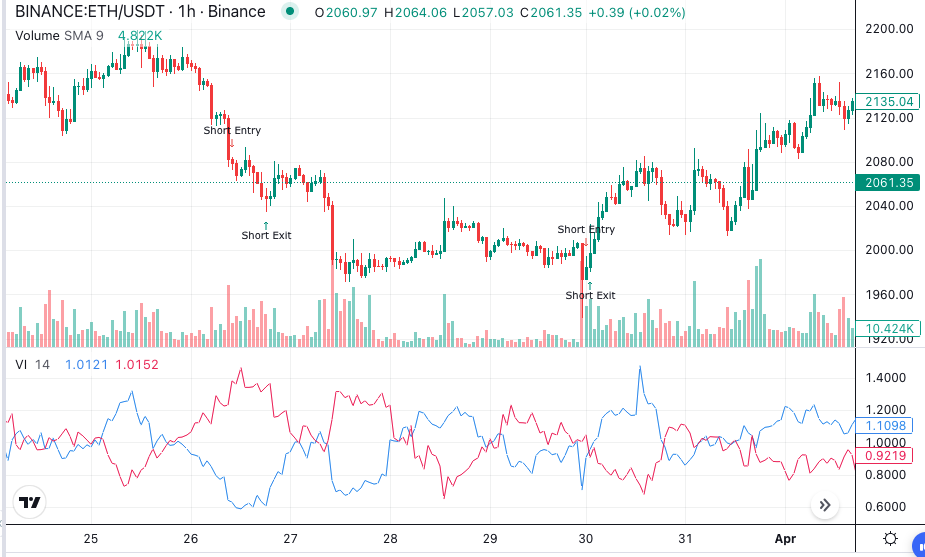
Most trend indicators smooth price and then ask which way the smoothed line points. A vortex indicator trading strategy asks something different: over the last fourteen candles, has buying pressure or selling pressure actually covered more ground?
That distinction matters. It means the Vortex indicator measures directional movement rather than direction of an average. It reacts to the character of the move, not just its slope.
This guide covers what the two lines measure, three setups worth testing, and a no-code build in Arrow Algo’s visual block builder. Treat the settings below as starting points for your own backtests.
What the Vortex Indicator Measures
The Vortex indicator was published by Etienne Botes and Douglas Siepman in 2010. It produces two lines that compete with each other.
The upward line, VI+, tracks the distance between each candle’s high and the previous candle’s low. That distance represents upward movement. The downward line, VI-, tracks the distance between each candle’s low and the previous candle’s high.
Both sums are divided by the true range over the same period. True range is simply how much ground price covered in a candle, including any gap from the previous close.
The result is two lines that usually sit somewhere between 0.5 and 1.5. When VI+ reads 1.2 and VI- reads 0.8, upward movement has dominated. The gap between them tells you how decisively.
Fourteen periods is the standard setting. Shorter periods react faster and cross more often. Longer periods cross less and hold direction longer. Our complete guide to the Vortex indicator covers the calculation in more detail.
The Two Lines and What a Crossover Means
The signal everyone starts with is the crossover. VI+ crossing above VI- suggests upward movement has taken control. The reverse suggests sellers have.
The width of the gap matters more than most traders realise. Two lines crossing and then separating quickly indicates a decisive shift. Two lines crossing and hovering within a whisker of each other indicates indecision, and usually produces a second crossing within a few candles.
Absolute levels carry information too. A VI+ reading above 1.2 with VI- below 0.8 marks a strong directional move. Both lines converging near 1.0 marks a market with no clear winner.
That convergence is the warning sign. It is where crossover systems generate their worst trades.
Three Vortex Indicator Trading Strategy Setups
Crossover entries with a separation filter
Take the standard crossover, then add one condition. Require the two lines to separate by a minimum distance before the entry counts.
A gap of 0.05 or more filters out a large share of the marginal crosses. The trade-off is familiar. You enter later and you skip the noise.
Exit when the lines cross back, or when the gap collapses below your threshold. A closing gap tells you the trend is losing its grip before price confirms it.
Trend continuation on a failed cross
This is the more interesting setup. In a strong uptrend, VI- will occasionally rise toward VI+ without crossing it, then fall away again.
That near-miss is a pullback that failed to become a reversal. Entering when VI- turns back down, while VI+ stays on top, puts you in a continuation trade with a defined invalidation point.
The invalidation is clean: if the lines actually cross, the idea was wrong. That makes stop placement straightforward.
Vortex as an exit rather than an entry
You do not have to use the indicator for entries at all. Many systematic traders get more from it as an exit condition layered onto a different entry.
Enter on your usual signal. Exit when VI- crosses above VI+. This lets a trend-following exit ride winners while still reacting to a genuine character change.
Test it against your current exit before replacing anything. Sometimes it holds trades longer than an ATR stop, and sometimes that costs more than it earns.
Why Vortex Crossovers Fire Late in Choppy Markets
Every crossover system shares one weakness, and Vortex is no exception.
Ranging conditions produce constant crosses. When neither side dominates, both lines hover near 1.0 and swap positions repeatedly. Each swap is a trade, and most of them lose. Gate the strategy with a trend filter such as ADX above 20, or a flat-versus-sloping moving average check.
The period setting changes everything. A 14-period Vortex on a 5-minute chart behaves nothing like a 14-period Vortex on a daily chart. Test on the timeframe you intend to trade, not a convenient one.
Gaps distort true range. Crypto trades continuously, so this matters less than in equities. It still shows up around exchange outages and low-liquidity weekend hours.
Costs accumulate quietly. Crossover strategies trade often. Model your exchange fees and realistic slippage before you believe any equity curve.
The original Vortex indicator paper is worth reading if you want the authors’ own reasoning. Investopedia’s overview covers the standard interpretation more briefly.
Building a Vortex Indicator Trading Strategy in Arrow Algo
Every step below is drag-and-drop on the visual canvas. No code is involved.
Drop a Vortex block onto the canvas and set the period to 14. It outputs both VI+ and VI- as separate values you can wire independently.
Add a crossover block with VI+ in one input and VI- in the other. This fires on the moment the lines swap.
For the separation filter, add a subtract block to calculate the gap between the two lines. Feed that into a comparison block checking it against your minimum threshold.
Join the crossover and the comparison with a condition block set to AND. Both must be true, so a cross without conviction produces nothing.
Add an ADX block as the regime filter. Require a reading above 20 before any entry is allowed. This is the single change that most improves crossover systems.
For exits, wire a second crossover block in the opposite direction. Pair it with an ATR-based stop so your risk scales with current volatility rather than a fixed percentage.
Then backtest it. Arrow Algo pulls historical candles straight from Binance, Coinbase and HyperLiquid, so you are testing on the exchange’s own data. Run it across several assets and more than one market condition before you trust the result.
What to Test First
- The Vortex indicator compares upward and downward movement over a lookback period, rather than smoothing price.
- VI+ above VI- signals upward control. The gap between them signals conviction.
- A minimum separation filter removes a large share of marginal crossovers.
- The failed-cross continuation setup gives a cleaner invalidation point than a raw crossover.
- Vortex often works better as an exit layered onto an existing entry than as the entry itself.
- Ranging markets are the failure mode. An ADX or moving-average regime filter is close to mandatory.
- Model fees and slippage before judging any crossover system’s backtest.
Disclaimer: This content is for educational purposes only and does not constitute financial advice. Trading involves significant risk and you should only trade with capital you can afford to lose. Past performance is not indicative of future results. Always conduct your own research before making any trading decisions.
Ready to build your own automated trading strategies without writing a single line of code? Start for free at Arrow Algo and join thousands of traders who've made the switch to systematic trading.