In the world of technical analysis, the Aroon Indicator and Aroon Oscillator are powerful tools that help traders identify trends and potential reversals in the market. Developed by Tushar Chande in 1995, these indicators have gained popularity for their ability to provide insights into the strength and direction of a trend. In this blog post, we’ll explore how these indicators work, how they are calculated, and how they can be effectively used in trading strategies.
What is the Aroon Indicator?
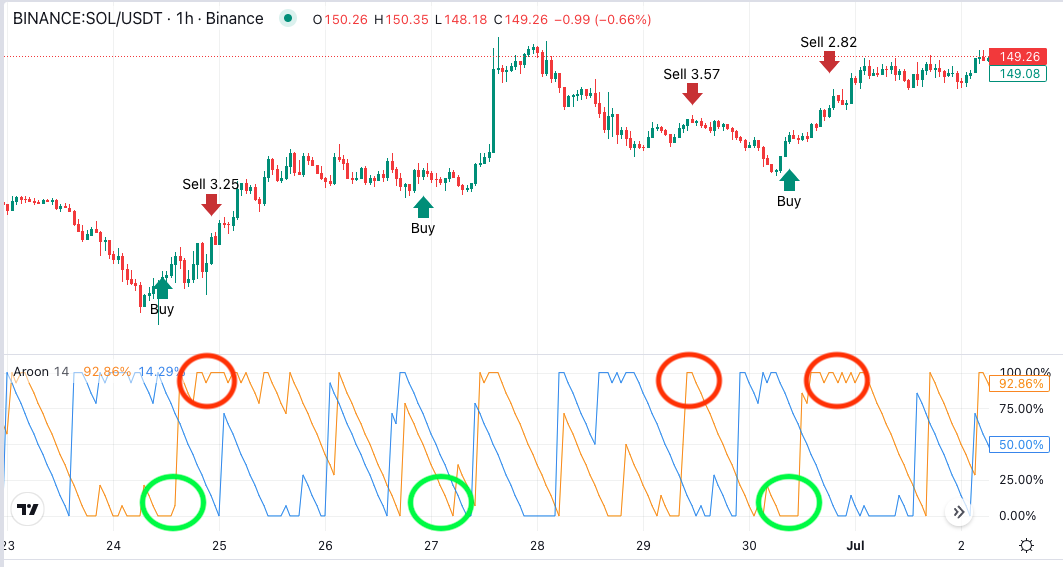
The Aroon Indicator is designed to reveal the strength of a trend and the likelihood of its continuation or reversal. It consists of two lines: Aroon Up and Aroon Down.
- Aroon Up: Measures the number of periods since the highest high during a specified time period. If the price is consistently setting new highs, the Aroon Up line will be near 100.
- Aroon Down: Measures the number of periods since the lowest low during a specified time period. If the price is consistently setting new lows, the Aroon Down line will be near 100.
The Aroon Indicator is typically plotted on a scale of 0 to 100. When the Aroon Up is above 70 and the Aroon Down is below 30, it indicates a strong uptrend. Conversely, when the Aroon Down is above 70 and the Aroon Up is below 30, it indicates a strong downtrend.
Calculating the Aroon Indicator
The Aroon Indicator is calculated using the following formulas:
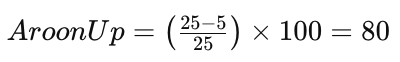
- Aroon Up = ((Number of periods – Periods since the highest high) / Number of periods) * 100
- Aroon Down = ((Number of periods – Periods since the lowest low) / Number of periods) * 100
For example, if you are using a 25-period Aroon Indicator and the most recent high was 5 periods ago, the Aroon Up would be:
What is the Aroon Oscillator?
The Aroon Oscillator is derived from the Aroon Indicator and is used to determine the strength of a trend. It is calculated by subtracting the Aroon Down from the Aroon Up:
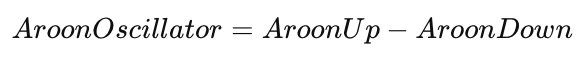
The Aroon Oscillator ranges from -100 to +100. When the Oscillator is above zero, it indicates a bullish trend, and when it is below zero, it indicates a bearish trend. The further away the Oscillator is from zero, the stronger the trend.
Practical Applications in Trading
The Aroon Indicator and Aroon Oscillator can be valuable tools in developing trading strategies:
- Identifying Trend Strength: The Aroon Indicator helps traders determine whether a market is trending or ranging. Strong trends are confirmed when one of the Aroon lines is near 100 while the other is near 0.
- Spotting Reversals: When the Aroon Up and Aroon Down lines cross, it may signal a potential trend reversal. For example, if the Aroon Up crosses below the Aroon Down, it could indicate the beginning of a downtrend.
- Timing Entries and Exits: Traders can use the Aroon Oscillator to time their entries and exits. A move above zero could be a buy signal, while a move below zero could be a sell signal.
- Combining with Other Indicators: The Aroon Indicator and Oscillator can be combined with other technical indicators, such as Moving Averages or the Relative Strength Index (RSI), to create more robust trading strategies.
Using Aroon Indicators on Arrow Algo
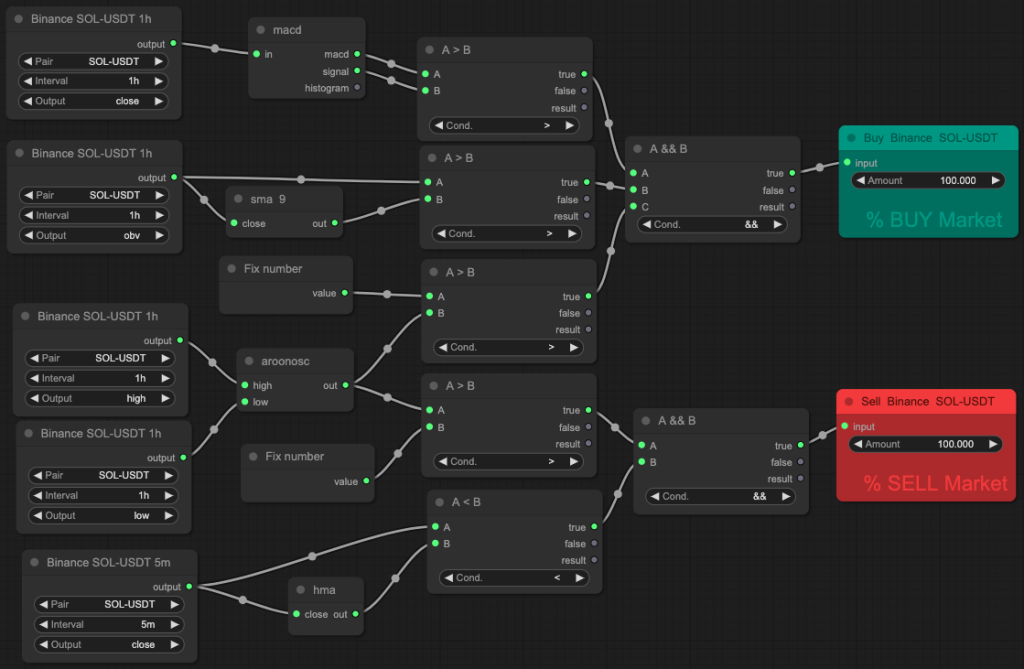
Arrow Algo makes it easy to incorporate the Aroon Indicator and Aroon Oscillator into your trading strategies. Here’s how you can do it:
- Select the Aroon Indicator: Log in to your Arrow Algo account and choose the Aroon Indicator from the list of available technical tools.
- Set Parameters: Customize the period length based on your trading style and the market you are analyzing.
- Build and Backtest Strategies: Use Arrow Algo’s no-code block builder to create strategies that leverage the Aroon Indicator and Oscillator. You can backtest these strategies against historical data to see how they would have performed in various market conditions.
- Optimize and Execute: Once you’ve fine-tuned your strategy, you can deploy it in live trading with confidence, knowing that your approach is backed by data-driven analysis.
Enhancing Your Trading with Aroon Indicators
The Aroon Indicator and Aroon Oscillator are versatile tools that can enhance your trading by providing clear signals about trend strength and potential reversals. Whether you’re a trend-following trader or looking for precise entry and exit points, these indicators can be an integral part of your trading toolkit.
By using platforms like Arrow Algo, you can easily integrate the Aroon Indicator into your strategies, backtest them, and make data-driven decisions to improve your trading performance. Start exploring the power of Aroon today and see how it can take your trading to the next level.
For more detailed guides and to get started, visit Arrow Algo and join our community on Discord.
Happy trading!
Did you enjoy this? You may like:
Leave a Reply