The Stochastic Oscillator is a powerful technical indicator widely used in trading to gauge the momentum and strength of price movements. It helps traders identify potential reversals and overbought or oversold conditions in the market. In this blog post, we will explore how the Stochastic Oscillator is calculated, how it can be applied in algorithmic trading, and how you can utilize it on the Arrow Algo platform.
How is the Stochastic Oscillator Calculated?
The Stochastic Oscillator is based on the idea that during an upward trend, prices tend to close near their high, and during a downward trend, they tend to close near their low. It compares a particular closing price of a security to a range of its prices over a certain period. The formula for calculating the Stochastic Oscillator is as follows:

Where:
- %K is the current value of the Stochastic Oscillator.
- C is the most recent closing price.
- L is the lowest price over the given period.
- H is the highest price over the given period.
The %D line, which is the moving average of %K, is typically used to smooth out the oscillator values and is calculated as:

Where:
- %D is the moving average of %K.
- SMA is the Simple Moving Average.
- n is the number of periods used for the moving average.
Using the Stochastic Oscillator in Algorithmic Trading
The Stochastic Oscillator is particularly useful for identifying overbought and oversold conditions. Here’s how you can use it in your trading strategies:
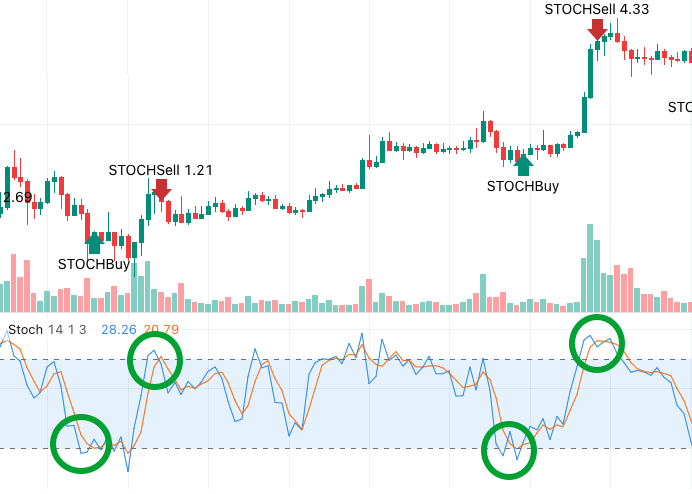
- Overbought and Oversold Signals: When the %K line rises above 80, it indicates that the security might be overbought, suggesting a potential selling opportunity. Conversely, when the %K line falls below 20, it indicates that the security might be oversold, suggesting a potential buying opportunity.
- Bullish and Bearish Divergences: A bullish divergence occurs when the price makes a new low, but the Stochastic Oscillator forms a higher low, indicating a potential reversal to the upside. A bearish divergence occurs when the price makes a new high, but the Stochastic Oscillator forms a lower high, indicating a potential reversal to the downside.
- Crossovers: When the %K line crosses above the %D line, it generates a buy signal. Conversely, when the %K line crosses below the %D line, it generates a sell signal.
Utilizing the Stochastic Oscillator on Arrow Algo
Arrow Algo makes it easy to integrate the Stochastic Oscillator into your trading strategies without requiring any coding knowledge. Here’s how you can do it:
- Accessing the Indicator: Log in to your Arrow Algo account and navigate to the strategy builder. Select the Stochastic Oscillator from the list of available indicators.
- Setting Parameters: Configure the parameters of the Stochastic Oscillator, such as the period for %K and %D, to match your trading strategy and market conditions.
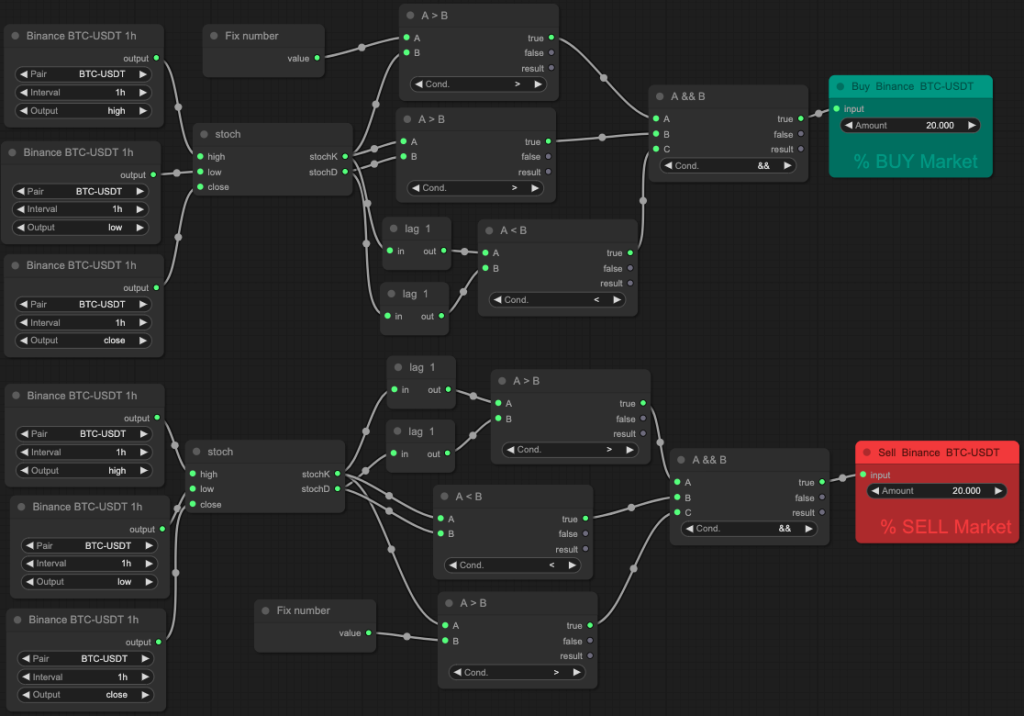
- Creating Rules: Use the no-code block builder to create rules based on the Stochastic Oscillator signals. For example, you can set a rule to buy when the %K line crosses above the %D line and sell when the %K line crosses below the %D line.
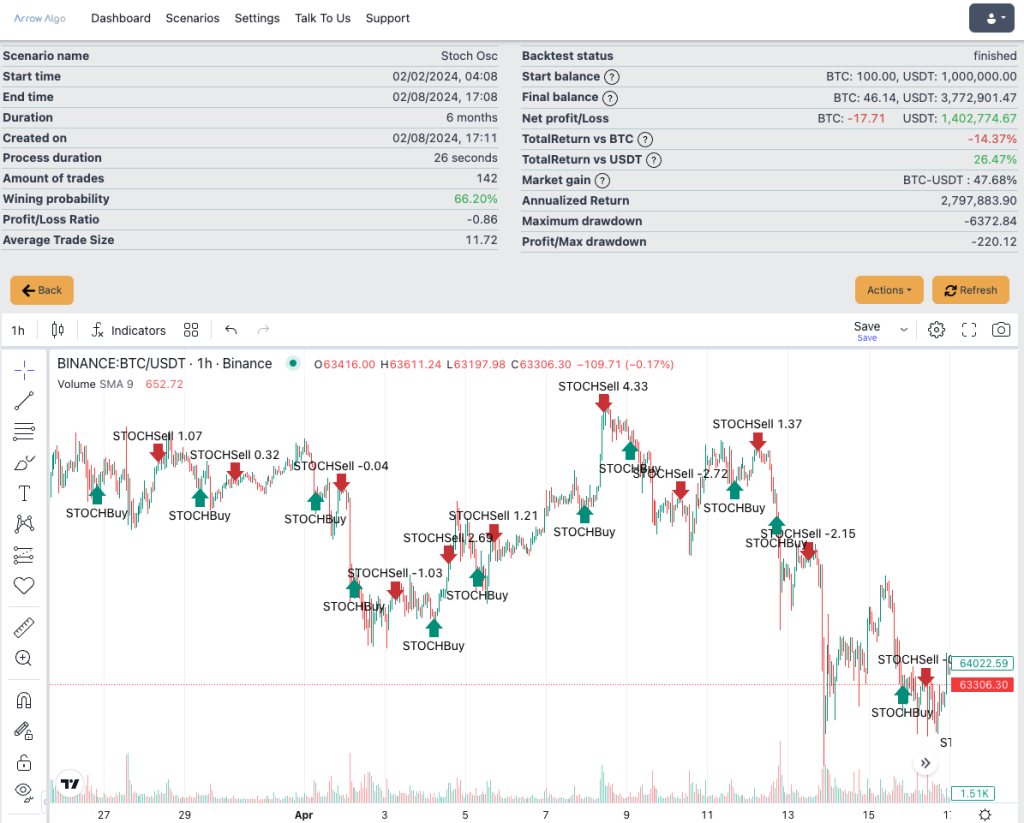
- Backtesting: Test your strategy against historical data using Arrow Algo’s robust backtesting tools. Analyze the results to refine and optimize your strategy.
Practical Application
For instance, you might create a strategy that buys when the %K crosses above 20 (indicating the end of an oversold condition) and sells when the %K crosses below 80 (indicating the end of an overbought condition). This can be further refined by looking for crossovers between %K and %D for additional confirmation.
Here’s a specific rule you can use:
- Buy Rule: If the %K crosses above the %D and the %K is below 20.
- Sell Rule: If the %K crosses below the %D and the %K is above 80.
With Arrow Algo, you can visually build these rules using the block builder, making the process intuitive and straightforward.

Here we achieve this on the hourly chart by looking for the current hourly high, low and closing prices and feeding them into the Stochastic Oscillator Indicator block and feeding the output into lag blocks condition blocks to check whether the previous value for %K was more than or less than the %D line in the previous hourly candle and has now crossed in the current hourly candle. We also compare the %K line to the fixed number block to check whether it is over or under 80/20.

By running a 6 month backtest on these rules alone we can see a winning probability of 66.2% and a 26.47% return. By combining the Stochastic Oscillator with additional indicators to validate the market trend, we can enhance this strategy further and achieve even better results
Expanding your trading toolkit
The Stochastic Oscillator is a versatile and powerful tool that can significantly enhance your trading strategies. By understanding how it works and incorporating it into your algorithmic trading with Arrow Algo, you can make more informed and strategic trading decisions. Start using the Stochastic Oscillator on Arrow Algo today and see how it can improve your trading performance.
For more detailed guides and to get started, visit Arrow Algo and join our community on Discord.
Happy trading!
Did you enjoy this? You may like:


Leave a Reply