
Accumulation Distribution Divergence Strategy: Build and Test It Without Code
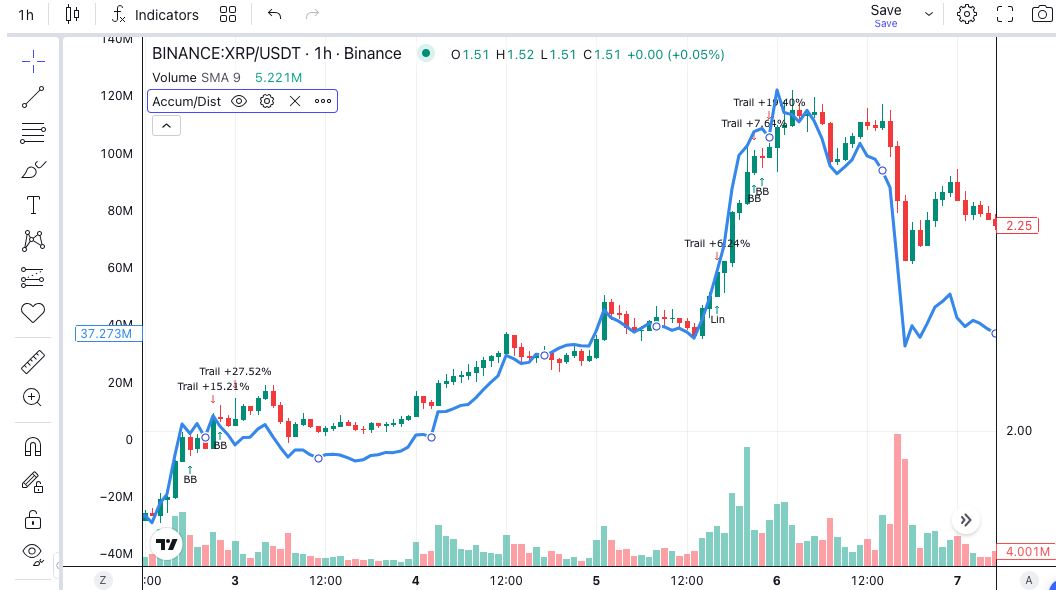
An Accumulation Distribution divergence strategy looks for the moment when price and volume stop agreeing. Price makes a new low. The Accumulation Distribution Line does not. Somebody is buying into the weakness, and the indicator shows it before the chart does.
That is the idea. Turning it into a rule a backtest can run is the work. This guide sets out one testable version. Every number below is a starting point for research, not a recommendation. No backtested performance is claimed.
Why Pair Divergence With the Accumulation Distribution Line?
Divergence can be built on almost any oscillator. RSI divergence and MACD divergence are the common choices. Both measure price momentum. They diverge when the pace of a move slows.
The Accumulation Distribution Line measures something different. It tracks where each candle closes inside its own range, weighted by volume. A candle that closes near its high on heavy volume adds a lot. A candle that closes near its low on heavy volume subtracts a lot. The running total is the line.
So an A/D divergence is not about momentum fading. It is about closes getting stronger while the lows get lower. Sellers push price down during the session. Buyers take it back by the close. Marc Chaikin, who created the indicator, designed it to catch exactly that. Investopedia’s entry covers the origin. Our Accumulation Distribution Line complete guide explains the reading in more depth.
This makes A/D divergence a reasonable partner for a momentum divergence. The two can confirm each other. When they disagree, the A/D reading tells you whether volume is behind the move.
What Does the A/D Line Actually Track?
The calculation has three plain steps per candle.
First, find where the close sits inside the high-low range. A close at the high scores +1. A close at the low scores -1. A close in the middle scores zero. This is the money flow multiplier.
Second, multiply that score by the candle’s volume. The result is the money flow volume for the candle.
Third, add it to the running total from the previous candle. That total is the Accumulation Distribution Line. StockCharts’ ChartSchool walks through a worked example.
Two consequences matter for strategy design. The line has no fixed scale. Its absolute value means nothing. Only its direction and its shape relative to price carry information. And the line ignores gaps between candles. A market that gaps down and then closes near its high will show accumulation even though the day was a loss. Crypto trades continuously, so this is a smaller problem than it is on stocks. It is still worth knowing.
How Do You Turn a Divergence Into a Rule a Backtest Can Run?
A human sees divergence by drawing two lines. A strategy needs a definition that holds on every candle without looking ahead.
The simplest testable version compares two windows.
Bullish divergence. The current close is at or below the lowest close of the last N candles. The current A/D reading is above the lowest A/D reading of the same N candles by some margin. Price has made a new low. The line has not.
Bearish divergence. The current close is at or above the highest close of the last N candles. The current A/D reading is below the highest A/D reading over the same window. Price has made a new high. The line has not.
Start with N at 20 on a 4-hour chart. That covers just over three days. A daily chart with N at 20 covers four weeks.
Why the Margin Matters
The A/D line has no scale. “Above the lowest reading” could mean one tick above. That is noise, not divergence. Define the margin as a fraction of the line’s recent range. A rule like “the A/D reading is at least 20% of its 20-candle range above its 20-candle low” is unambiguous. It can be tested and it can be tuned.
Rolling Windows Are Not Swing Points
Comparing a current value with a window minimum is a useful simplification. It is not the same as matching two confirmed swing lows. The window version fires earlier and more often. The swing version fires later and less often. Pick one, label it honestly, and do not describe the window version as pivot-based divergence.
Which Entry Variations Deserve a Side-by-Side Test?
The divergence condition is a setup. It still needs a trigger. Compare three versions on the same data before choosing.
Variation A: divergence only. Enter when the bullish divergence condition becomes true. Fastest entry, most trades, most false starts. This is the baseline.
Variation B: divergence plus price confirmation. Wait for the divergence condition, then require the close to exceed the previous candle’s high. The line said buyers are present. Price has to prove it.
Variation C: divergence plus A/D turn. Require the A/D line to cross above its own short moving average after the divergence appears. A 10-period average on the line works as a first test. This waits for the accumulation to accelerate.
Mirror each version for the short side. Then compare trade count, average holding time and profit factor. Variation A usually has the most trades and the weakest average. The question is whether B or C keeps enough of the trades to matter.
Where Do Exits and Position Limits Fit?
A reversal entry needs a tight stop. The whole thesis is that the low is in. If price makes a meaningfully lower low, the thesis is wrong.
Place the initial stop below the lowest low of the divergence window. Add a small ATR buffer so a single wick does not close the trade. One ATR is a common starting point.
For the target, two mechanical options exist. The first is a fixed multiple of the stop distance, such as two to one. The second is an indicator exit, where the position closes when the A/D line crosses back below its moving average. The first is simpler to analyse. The second lets winners run but gives back more at the end.
Keep a maximum holding time too. If the reversal has not developed after 20 candles, the setup has gone stale. Exit and wait for the next one.
Position size should be a fixed percentage of balance, or scaled by the stop distance. Never size up because a divergence “looks clean”.
What Traps Catch A/D Divergence Backtests?
Exchange volume is not universal volume. The A/D line depends on volume, and every exchange reports its own. A backtest on Binance data describes Binance. Run it again on the venue where the strategy would actually run.
Look-ahead in the window. The condition must only use candles that have closed. A rule that checks “the lowest close in the last 20 candles” must exclude the current candle until it closes. Most builders handle this correctly. Check the trace to be sure.
Divergence in a trend. Bullish divergence appears repeatedly in a strong downtrend. The line turns up, price makes another low, the line turns up again. A trend filter removes the worst of these. Only take bullish divergences when price is above a long moving average, or when ADX is below a threshold.
Too few trades. A strict divergence rule on a daily chart might fire ten times in two years. That is not enough to trust. Loosen the rule, drop to a lower timeframe, or test across several markets before drawing a conclusion.
Counting the same divergence twice. The window condition can stay true for several candles. Without a reset rule, the strategy enters, exits and re-enters on the same pattern. Require the condition to go false before it can fire again.
Setting Up the Accumulation Distribution Divergence Strategy in Arrow Algo
Every piece of the rule set maps to a visual block. No code is involved.
- Data Watcher. Set the market and timeframe. Start on a 4-hour chart for a reasonable trade count.
- A/D block. Connect high, low, close and volume from the Data Watcher. The block outputs the running line.
- Min and Max blocks on price. Add a lowest-value block over 20 candles on close. This gives the price floor to compare against.
- Min and Max blocks on the A/D output. Add a lowest-value block over 20 candles on the A/D line. Add a highest-value block over the same window to derive the range for the margin.
- Comparison blocks. One condition checks that close is at or below its 20-candle low. Another checks that the A/D reading exceeds its 20-candle low by the chosen margin.
- AND gate. Combine the two conditions with an AND condition block. Both must be true.
- Trigger. For Variation B, add a condition that close exceeds the previous high and feed it into a third AND input. For Variation C, add a moving average on the A/D output and a crossover block.
- Trend filter. Feed a long EMA or an ADX block into the AND gate.
- Buy action block. Connect it to the AND output. Set position size as a percentage of balance.
- Exit rules. Add a stop-loss using the 20-candle low minus one ATR, a take-profit at two times the stop distance, and a time-based exit.
Mirror the logic for the short side. Run the backtest on exchange data. Then open the trace and check several entries candle by candle. Confirm the divergence was knowable at the moment the order fired.
The OBV divergence strategy uses the same two-window construction. Testing both on one market shows which volume measure fits it better.
Once a version has been tested and reviewed, the user decides whether to deploy it. If they do, the rules send buy and sell signals to the user’s own exchange account. The exchange decides whether to accept and execute each order.
What to Take Away
- An Accumulation Distribution divergence strategy catches closes strengthening while lows keep falling. It is a volume story, not a momentum story.
- Define divergence as a two-window comparison with a margin, so the rule holds on every candle.
- Compare divergence-only, price-confirmed and A/D-turn entries on the same data.
- Stop below the divergence window’s low. Add a time exit for setups that go nowhere.
- Test on the exchange’s own volume, add a trend filter, and require a reset between signals.
- Every block above exists in Arrow Algo’s visual builder, so the whole test runs without code.
Disclaimer: This content is for educational purposes only and does not constitute financial advice. Trading involves significant risk and you should only trade with capital you can afford to lose. Past performance is not indicative of future results. Always conduct your own research before making any trading decisions.
Ready to build your own automated trading strategies without writing a single line of code? Start for free at Arrow Algo and join thousands of traders who've made the switch to systematic trading.