
ADX + DI Directional Strategy: How to Build It in Arrow Algo
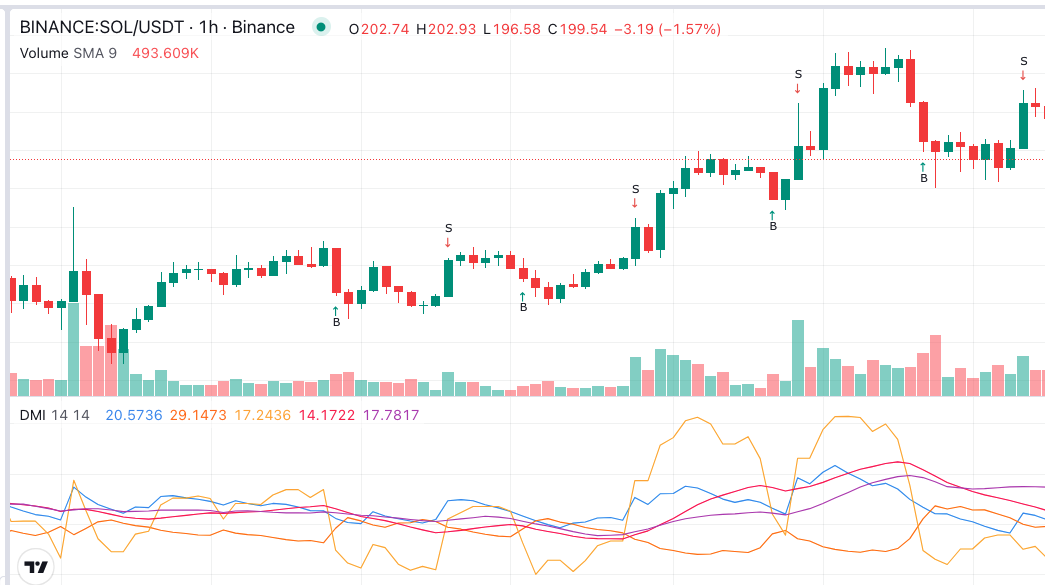
The ADX DI strategy turns Wilder’s Directional Movement System into a complete trading signal: DI+ and DI- supply the direction, and the ADX confirms there is enough trend strength to act on it. Yesterday we covered the ADX trend strength strategy, where the ADX filters someone else’s entry signal. Today we go one step further — the DI lines generate the entries themselves.
What Is the ADX DI Strategy?
The strategy comes from the full Directional Movement Index (DMI) system, described in Investopedia’s DMI guide. It uses three lines that are calculated together:
- DI+ (Positive Directional Indicator): measures upward price pressure
- DI- (Negative Directional Indicator): measures downward price pressure
- ADX: measures the strength of whichever side is winning
The core rule is simple. Go long when DI+ crosses above DI-, but only if the ADX confirms a real trend. Go short — or exit — when DI- crosses above DI+. Direction and strength are separated into different lines, so each part of the decision is explicit.
How Do DI+ and DI- Show Market Direction?
Each bar, the system asks two questions. Did today’s high push further up than yesterday’s high? Did today’s low push further down than yesterday’s low? The larger of the two movements wins the bar. Upward wins feed DI+, downward wins feed DI-, and both are smoothed over a period — 14 bars is standard.
When DI+ sits above DI-, buyers are consistently pushing prices to new highs. When DI- is on top, sellers dominate. The gap between the lines shows how one-sided the battle is. That gap is exactly what the ADX smooths into its strength reading, which is why the three lines belong together.
When Does a DI Crossover Become a Trade?
A raw DI crossover fires often — too often. In a ranging market, the lines braid around each other and produce constant false signals. That is where the ADX gate earns its place:
- DI+ crosses above DI- with ADX above 25: a valid long signal in a confirmed trend
- DI+ crosses above DI- with ADX below 20: ignore it — the market is drifting, not trending
- Crossover with ADX rising through 20: an aggressive early entry as a new trend forms
- Opposite crossover while in a trade: the classic exit — the directional battle has flipped
Wilder also suggested an extreme point rule: after a crossover, enter only when price passes the high (or low) of the crossover bar. It is a built-in confirmation buffer that skips the weakest signals.
How to Trade the ADX DI Strategy in Practice
Variant 1 — the classic gated crossover. Long on DI+ crossing above DI- while the ADX reads above 25. Exit on the reverse crossover. This is the cleanest expression of the system and a strong baseline for backtesting.
Variant 2 — the early-trend version. Require the ADX to be rising rather than above a fixed level. This catches younger trends earlier, at the cost of more false starts. It suits volatile crypto pairs where trends move fast once they ignite.
Variant 3 — the strength-scaled exit. Enter on the gated crossover, but exit when the ADX rolls over from above 40 instead of waiting for the opposite crossover. Trends often weaken well before the DI lines flip, and a falling ADX from a high level is the earliest warning available.
What Mistakes Weaken DI Crossover Systems?
- Trading every crossover. Ungated DI crossovers are among the noisiest signals in technical analysis. The ADX condition is not optional — it is the strategy.
- Confusing line height with price direction. DI- rising means downward pressure is increasing. Read the lines as pressure gauges, not price proxies.
- Using tight stops with a slow system. The DMI reacts gradually. Pair it with volatility-based stops rather than fixed tight ones, or the exits will contradict the entries.
- Testing one market and assuming it generalises. Crossover frequency varies hugely between pairs and timeframes. Backtest each combination separately.
How to Build the ADX DI Strategy in Arrow Algo
Arrow Algo’s visual builder includes a dedicated DI block that outputs both DI+ and DI-, plus an ADX block for the strength gate. Drag both onto the canvas. Connect the DI outputs to a crossover block to detect the moment DI+ crosses above DI-. Then combine that signal with an ADX condition — above 25, or rising — through a logic block, and route the result to your entry.
The exit is the mirror image: a crossover block watching for DI- to retake the lead. Everything snaps together with drag-and-drop blocks, no code involved. Backtest all three variants on live exchange data from Binance, Coinbase or HyperLiquid and compare trade counts, win rates and drawdowns before you commit to one.
What Are the Key Takeaways?
- DI+ and DI- provide direction; the ADX provides the strength gate — the ADX DI strategy needs both
- Long when DI+ crosses above DI- in a confirmed trend; the reverse crossover is the natural exit
- Ungated crossovers are noise — filter with ADX above 25 or a rising ADX
- A falling ADX from above 40 can exit trades earlier than the DI lines will
- Backtest per pair and timeframe — crossover behaviour does not transfer between markets
Disclaimer: This content is for educational purposes only and does not constitute financial advice. Trading involves significant risk and you should only trade with capital you can afford to lose. Past performance is not indicative of future results. Always conduct your own research before making any trading decisions.
Ready to build your own automated trading strategies without writing a single line of code? Start for free at Arrow Algo and join thousands of traders who’ve made the switch to systematic trading.