
Balance of Power Strategy: Three Years of Crypto Tests
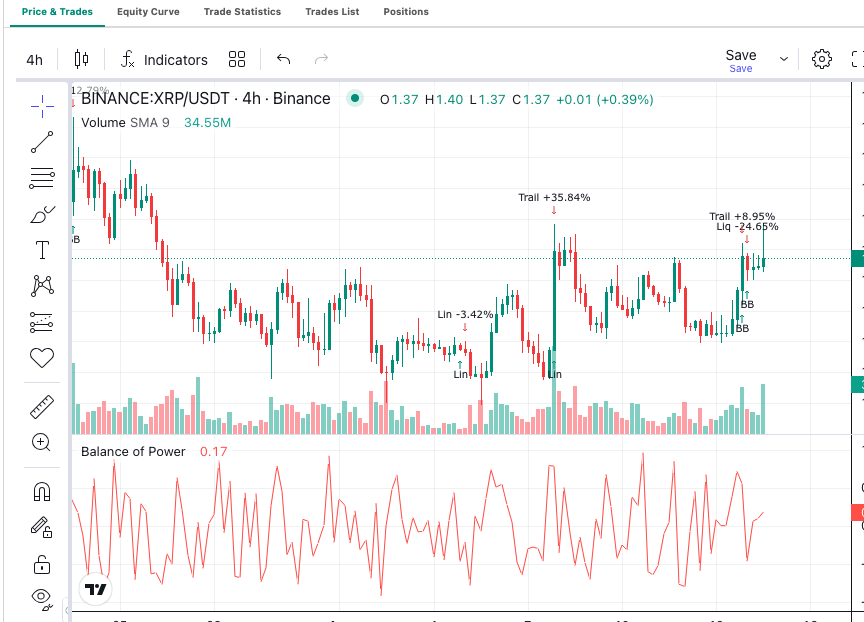
Does knowing who won each candle help you trade the next one? A balance of power strategy bets that it does. It buys when buyers have closed candles strongly for a sustained stretch. We put that idea against a plain price rule on three years of crypto data. The price rule won more often than it lost.
The rules below are hypotheses to test, not a recommendation.
What Does Balance of Power Measure?
Balance of Power (BOP) compares each candle’s body with its full range. The raw value is the close minus the open, divided by the high minus the low. It always sits between -1 and +1.
A reading of +1 means price opened at the low and closed at the high. Buyers controlled the whole candle. A reading near zero means a small body inside a wide range. Neither side won.
Raw BOP jumps around too much to trade. Most traders smooth it with a 14-period simple moving average. Our Balance of Power guide covers the calculation and the usual readings in full.
Turning BOP Into a Momentum Rule
Momentum strategies assume a move in progress tends to continue. For BOP, the momentum signal is the smoothed line crossing above zero. That means buyers have won more of the last 14 candles than sellers.
Entry and Exit Conditions
Use four-hour candles. Generate a long entry signal when smoothed BOP crosses above zero on a completed candle and no position is open.
Exit on the first of two events:
- Smoothed BOP drops back below zero.
- The close falls more than two times the 14-period Average True Range (ATR) below entry. ATR measures typical candle movement.
The Control You Must Run
BOP is built from the same candles as price. So the fair question is whether it adds anything a simple price rule misses.
The control buys when the close crosses above its 14-period simple moving average (SMA). It exits when the close drops back below that average. The same ATR stop applies. Both rules look back 14 candles, so they react on a similar timescale.
What Happened on Three Years of Crypto Data?
We tested both rules on Binance four-hour candles from 10 November 2023 to 10 November 2026. We charged 0.1% per side and filled at the signal candle’s close. Stops filled at the stop price, or at the open if price gapped through it. Indicators had six months of earlier data to warm up.
| Market, 4-hour | Control: trades per year | Control: return | Control: max drawdown | BOP rule: trades per year | BOP rule: return | BOP rule: max drawdown | Buy-and-hold |
|---|---|---|---|---|---|---|---|
| BTC | 159 | -57.3% | 68.4% | 149 | -46.0% | 64.7% | +102.1% |
| ETH | 156 | -8.4% | 49.6% | 158 | -31.7% | 65.4% | -1.3% |
| SOL | 155 | -6.3% | 71.8% | 151 | -28.9% | 71.3% | +78.5% |
Hypothetical rule tests on past data, with no slippage. They are not trading results, and past behaviour may not repeat.
Both rules lost money on every market. Max drawdown is the largest peak-to-trough fall in account value. Drawdowns above 60% would end most real accounts.
Both rules traded about three times a week. Fees on that many trades ate any edge. BOP beat the control on BTC but lost to it on ETH and SOL.
Adding a Trend Filter
Momentum rules usually work better in an uptrend. We added one condition to both versions: the close must sit above the 200-period exponential moving average (EMA).
| Market, 4-hour | Control: trades per year | Control: return | Control: max drawdown | BOP rule: trades per year | BOP rule: return | BOP rule: max drawdown |
|---|---|---|---|---|---|---|
| BTC | 88 | -20.5% | 46.8% | 75 | -0.1% | 34.5% |
| ETH | 80 | +146.6% | 28.9% | 76 | +66.7% | 34.9% |
| SOL | 79 | +127.3% | 35.5% | 76 | -3.9% | 56.2% |
Same assumptions as above.
The filter halved the trade count and helped every version. The pattern held, though. BOP did better on BTC. The plain price rule did far better on ETH and SOL.
What About BOP as a Confirmation Filter?
We tried one more version. It kept the price cross but only took it when smoothed BOP was above 0.1. The idea was to wait for buyers to prove themselves.
It cut trades to about 20 a year. It also lost money on all three markets, with or without the trend filter. Waiting for strong candles meant buying later in each move.
How Should You Read These Results?
The honest summary is that BOP did not beat a simple price rule on these tests. It won on one market out of three, and lost badly on SOL with the trend filter.
That makes sense. BOP and a moving average both read the same candles. When two rules share an input, they often take similar trades. The extra calculation adds a setting to tune without adding new information.
Win rates were low, between 21% and 29%. That is normal for momentum rules. They lose often and rely on a few large winners. Our post on return skew explains why that shape needs patience.
Where Do Balance of Power Backtests Go Wrong?
Trading raw BOP. Unsmoothed BOP flips sign almost every candle. A crossover rule on raw values would trade constantly and pay fees each time.
Skipping the control. A BOP result means little on its own. Compare it with a price rule on the same lookback.
Ignoring trade count. Around 150 trades a year at 0.1% per side costs about 30% a year in fees alone. Check fees before blaming the indicator.
Check the Candles Too
Thin candles. BOP divides by the candle’s range. Very small ranges, common on quiet hours or illiquid pairs, produce extreme readings from tiny moves.
Gaps. Crypto rarely gaps, but stock data does. BOP ignores the move from the last close to the next open, so a gap up with a weak close still reads as selling.
Tuning until it wins. Trying 7, 10, 14 and 21 periods until SOL turns positive is curve fitting. Log every setting you try. Our post on simple vs complex trading strategies shows how fast extra settings inflate a backtest.
Building the Balance of Power Strategy in Arrow Algo
The drag-and-drop visual builder expresses the rule as a short chain of visual blocks:
- Add the exchange’s candle data and select the four-hour timeframe.
- Connect the candles to a BOP block. Smooth its output with a 14-period SMA block if the block does not smooth it already.
- Add a condition block that checks the smoothed line crossed above zero.
- Join it with a flat-position check using an AND condition block.
- Connect the result to a buy action block. Under your rules, that block sends a signal.
- Build the exits: smoothed BOP below zero, or a two-ATR stop below entry.
- Join the exits with an OR condition block into a sell action block.
Add the 200 EMA filter as a third input to the entry AND block. Then duplicate the strategy and swap the BOP blocks for a close-crosses-SMA condition. Run both on the same data and fee settings.
No deployment is needed for any of this. If you later choose to deploy, your rules signal your own exchange account. The exchange decides whether to execute each order.
What Should You Take Into Your Own Test?
- A balance of power strategy buys when smoothed BOP crosses above zero.
- Without a trend filter, both BOP and a plain price rule lost money on BTC, ETH and SOL.
- A 200 EMA filter helped every version, but the price rule still beat BOP on ETH and SOL.
- Using BOP to confirm a price cross made results worse, because it delayed entries.
- Treat BOP as one more view of the same candles. Always test it against a simpler rule.
Disclaimer: This content is for educational purposes only and does not constitute financial advice. Trading involves significant risk and you should only trade with capital you can afford to lose. Past performance is not indicative of future results. Always conduct your own research before making any trading decisions.
Ready to build your own automated trading strategies without writing a single line of code? Start for free at Arrow Algo and join thousands of traders who've made the switch to systematic trading.