
Calmar Ratio: Evaluate Strategy Risk the Right Way
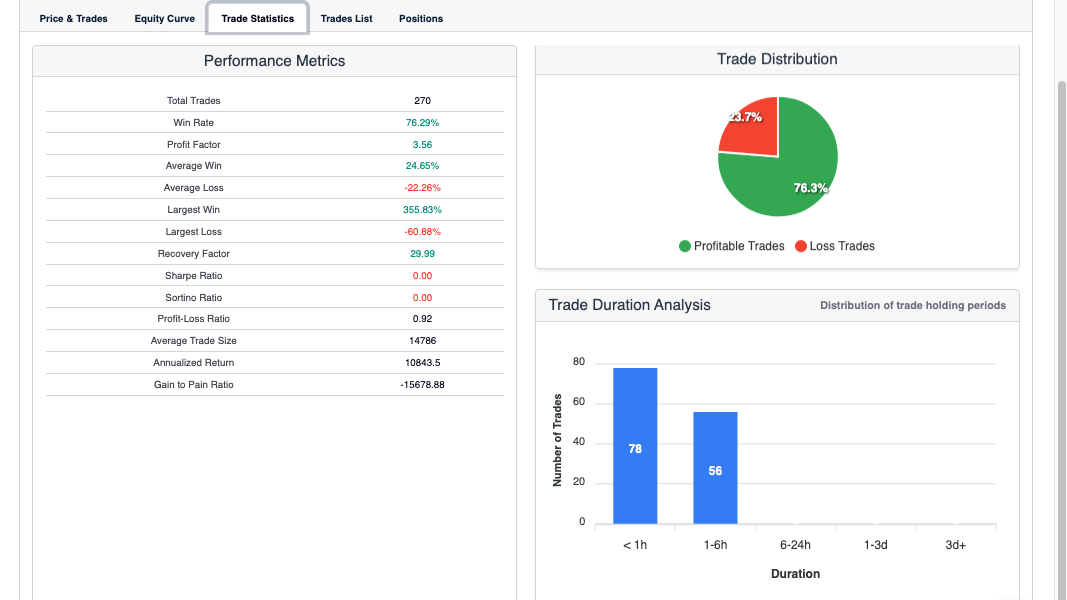
The Calmar ratio answers a question the Sharpe ratio cannot: for every percentage point of return this strategy generates, how much drawdown did it require? By measuring annual return against maximum drawdown, the Calmar ratio focuses directly on the worst investor experience — not average volatility, but the deepest sustained loss in the strategy’s history.
What Is the Calmar Ratio?
The Calmar ratio is a risk-adjusted performance measure that divides a strategy’s annualised return by its maximum drawdown over the same period. Both are expressed as positive percentages.
A strategy returning 30% annually with a 15% maximum drawdown has a Calmar ratio of 2.0. A strategy returning 30% with a 40% maximum drawdown has a Calmar ratio of 0.75. Both deliver the same headline return — but the Calmar ratio reveals that the second strategy required the investor to sit through a loss more than twice as large to achieve it.
The standard calculation uses a three-year lookback period, though shorter or full-history versions are also used depending on the context.
How Is the Calmar Ratio Calculated?
The calculation has three steps:
Step 1: Calculate the annualised return over the measurement period. If a strategy returned 90% over three years, the annualised figure is approximately 24.9%.
Step 2: Identify the maximum drawdown — the largest peak-to-trough decline during the same period. If the strategy fell 25% from its highest point to its lowest before recovering, the maximum drawdown is 25%.
Step 3: Divide the annualised return by the maximum drawdown. In this example: 24.9 / 25 = 0.996.
A Calmar ratio below 1 means the strategy’s maximum drawdown exceeded its annual return — an investor could have waited more than a full year just to recover from the worst loss period. Above 1 means annual returns exceed the worst drawdown. Above 2 is generally considered strong, and above 3 is exceptional.
What Calmar Ratio Values Mean in Practice
Context matters when interpreting Calmar ratios. A ratio of 1.5 for a low-volatility bond strategy is underwhelming. The same ratio for a crypto strategy is competitive, given the inherent volatility of digital assets.
As a general guide for systematic crypto strategies:
- Below 0.5: The drawdown risk substantially exceeds annual returns — the strategy is poorly calibrated for risk
- 0.5–1.0: Marginal — returns are approaching but not exceeding the worst loss
- 1.0–2.0: Acceptable to good — returns meaningfully exceed the maximum drawdown
- Above 2.0: Strong — annual return is more than twice the worst drawdown sustained
- Above 3.0: Exceptional — the level targeted by professional fund managers
One important caveat: the maximum drawdown in a backtest is almost always lower than the maximum drawdown in live trading. New data produces new drawdown events. When evaluating a strategy’s Calmar ratio from backtests, apply a conservative adjustment to account for this.
Calmar Ratio vs Sharpe Ratio vs Sortino Ratio
These three metrics measure risk-adjusted return differently, and each has a distinct use case:
The Sharpe ratio divides excess return by total standard deviation — it penalises both upside and downside volatility equally. A strategy with large upside swings is penalised the same as one with large losses.
The Sortino ratio divides excess return by downside deviation only, ignoring upside volatility. It answers: “How well does this strategy perform relative to its downside risk?” The Sortino ratio is better suited to evaluating strategies with asymmetric return distributions.
The Calmar ratio uses maximum drawdown rather than any form of deviation. It directly answers: “How much did the worst sustained loss cost, and was the annual return worth it?” This is the most intuitive measure for investors who need to understand the worst-case scenario they would have lived through.
Use all three together: Sharpe for broad risk efficiency, Sortino for downside risk specifically, and Calmar for the extreme-loss comparison. A strategy with a high Sharpe but low Calmar often has smooth volatility but occasionally produces severe drawdowns — a pattern that Sharpe alone would miss.
How to Use the Calmar Ratio to Evaluate Strategies in Arrow Algo
Arrow Algo’s backtest results provide both annualised return and maximum drawdown for every strategy run. Calculating the Calmar ratio is a single division:
Run a backtest on your scenario. Note the annualised return percentage and the maximum drawdown percentage from the results. Divide the first by the second. That is your Calmar ratio for that parameter configuration.
Where the Calmar ratio becomes most useful in Arrow Algo is during parameter optimisation. When comparing different configurations, sort by Calmar ratio rather than raw return. A configuration returning 25% annually with a 10% drawdown (Calmar 2.5) is substantially preferable to one returning 35% with a 30% drawdown (Calmar 1.2), even though the raw return is lower.
Use Calmar alongside the full Arrow Algo backtest metrics suite — win rate, Sharpe ratio, and trade count — to build a complete picture of strategy quality before any live deployment.
Key Takeaways
- The Calmar ratio divides annualised return by maximum drawdown — a direct measure of whether returns justify the worst loss sustained
- Calmar above 1 means annual returns exceed the worst drawdown; above 2 is strong; above 3 is exceptional
- Unlike Sharpe and Sortino, Calmar focuses on the worst single loss period — the most intuitive risk measure for investors
- Use Calmar alongside Sharpe and Sortino for a complete risk-adjusted picture of strategy performance
- During parameter optimisation, sort configurations by Calmar ratio rather than raw return to find genuinely robust strategies
- Arrow Algo provides both annualised return and max drawdown in every backtest — the Calmar ratio is one division away
Disclaimer: This content is for educational purposes only and does not constitute financial advice. Trading involves significant risk and you should only trade with capital you can afford to lose. Past performance is not indicative of future results. Always conduct your own research before making any trading decisions.
Ready to build your own automated trading strategies without writing a single line of code? Start for free at Arrow Algo and join thousands of traders who’ve made the switch to systematic trading.