
Chande Forecast Oscillator Strategy: How to Build It in Arrow Algo
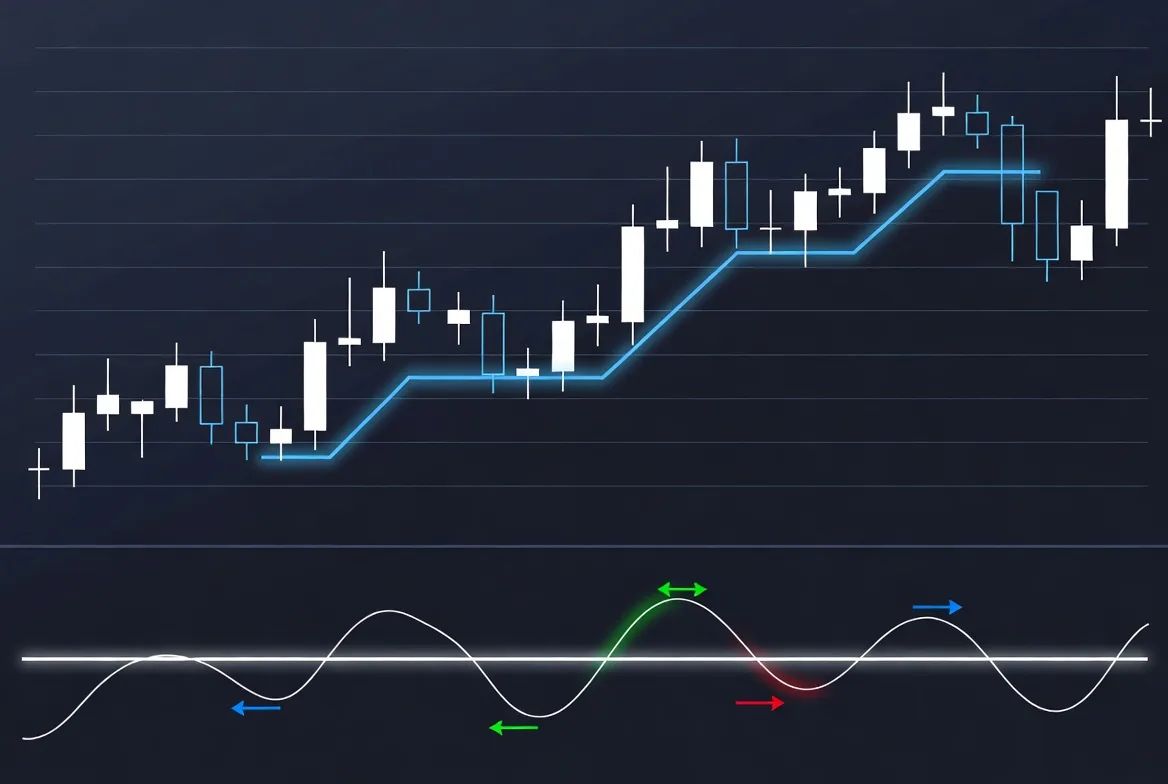
Build a Chande Forecast Oscillator strategy around one question: has price recovered above its recent regression reference? The indicator’s name sounds predictive. Its useful role here is more modest: measuring a deviation and turning its recovery into a testable event.
This guide develops a long-only research example with a trend filter and explicit exits. The settings illustrate a hypothesis. They do not represent measured performance or recommended parameters.
For the indicator’s background, start with our Chande Forecast Oscillator guide. Here, the focus is building and evaluating rules.
What Does the Chande Forecast Oscillator Actually Compare?
The Chande Forecast Oscillator, or CFO, compares closing price with a linear regression reference. It expresses the difference as a percentage of closing price.
Linear regression fits a straight line through recent observations. The line summarises their direction, rather than connecting each price individually. NIST’s regression explanation describes how the fit minimises squared differences between observations and model values.
For the close-minus-reference convention used here, positive readings put price above the reference. Negative readings put it below. Zero marks equality.
This is different from measuring trend direction. A declining market can briefly trade above its regression reference. A steadily rising market can remain close to its fitted line. Neither observation alone identifies a profitable entry.
How Does the Calculation Become a Trading Signal?
First, choose a lookback, such as 14 completed candles. Fit the regression reference using those observations. Subtract that reference from the current close. Divide the difference by the close, then multiply by 100.
For example, a $100 close against a $99 reference gives a positive 1% reading. That describes the current gap. It does not forecast a 1% gain.
The Trading Technologies CFO formula documents the close-minus-regression calculation. Its introductory sign description conflicts with its displayed formula. Check calculations rather than relying on labels alone.
Implementations can also differ in their regression reference timing. When comparing tools, verify whether they use a fitted endpoint or a projected value. Match that convention before comparing signals.
Our example uses a fresh cross from zero or below to above zero. Remaining positive for ten candles creates one crossing event, rather than ten new entries.
Which CFO Readings Deserve Confirmation?
A zero-line cross says that price changed sides of its moving reference. It does not explain why. A recovery inside an uptrend and a brief bounce inside a downtrend can produce similar readings.
Use a separate direction filter to distinguish those situations. For this example, require the close above a 50-period exponential moving average. Also require that average above its value five candles earlier.
These conditions express a specific hypothesis: recoveries above the regression reference may behave differently within an established rise. They add delay and reduce eligible signals. Whether they improve results remains a backtest question.
Avoid importing RSI thresholds. CFO has no universal 70 or 30 boundary. The size of its deviations depends on the market, timeframe and calculation settings.
Which Chande Forecast Oscillator Strategy Should You Test First?
Baseline: A Fresh Zero-Line Recovery
Use one-hour candles for the initial research version. Set CFO to 14 periods and the trend average to 50 periods.
Generate a long entry signal only when all these conditions hold:
- CFO was zero or negative on the previous completed candle and is positive now.
- The current close sits above the 50-period average.
- That average exceeds its value five completed candles earlier.
- The strategy has no existing position.
Evaluate the signal at the candle close. Model the fill at the next available price, including costs. Knowing a completed candle’s close does not guarantee a fill at that exact price.
Variant: Add a Small Buffer
Near-zero crossings can alternate rapidly. A second version can require CFO to cross a small positive threshold instead.
Choose the threshold using training data only. Keep the other rules unchanged. This isolates the buffer’s contribution rather than testing several changes together.
The trade-off is clear: waiting for a larger deviation means a later entry. A cleaner-looking chart does not prove a better net result.
Alternative: Use CFO Only as a Filter
A third version keeps a separate price-breakout entry and requires CFO to be positive. Here, CFO qualifies the signal instead of creating it.
Compare the breakout with and without that condition on identical dates. This asks whether the indicator contributes useful information. Do not assume a second indicator improves the first.
What Ends the Trade, and How Much Can It Risk?
Give the baseline two independent exit conditions. One responds to the signal failing; the other limits planned price risk.
The signal exit occurs when CFO crosses below zero on a completed candle. For the research example, place the initial protective threshold two ATR below the modelled entry. ATR measures recent price movement, including gaps.
Capture ATR at entry for that initial threshold. Do not let a later volatility increase silently widen the planned loss. If testing a trailing alternative, specify how it can tighten.
Choose position size from the loss budget and entry-to-stop distance. Include expected costs and respect exchange size limits. A stop threshold does not guarantee the eventual exit price.
Record which exit condition triggered each trade. That reveals whether CFO adds value or simply duplicates the protective threshold.
Which Mistakes Can Distort a CFO Backtest?
Confusing deviation with direction. A positive reading can occur during a larger decline. Compare the filtered strategy with the unfiltered baseline.
Using unfinished candles. An intrabar crossing can disappear before the close. Keep signal evaluation consistent with the intended strategy.
Ignoring indicator warm-up. The average, its lagged value and CFO all need valid history. Exclude entries until every required input exists.
Check Behaviour Beyond the Best Chart
Optimising too many settings. Lookback, average length, slope window and buffer already create several choices. Keep a record of every tested version.
Letting costs disappear. Frequent small winners can become losers after fees and slippage. Inspect net average trade results and trade count together.
Treating fewer losses as proof. A filter may remove winners too. Evaluate drawdown, missed moves and untouched test data, not just win rate.
Building the Chande Forecast Oscillator Strategy in Arrow Algo
Use the drag-and-drop visual builder to express the baseline as connected visual blocks:
- Add the chosen exchange’s candle data and select the research timeframe.
- Connect closing prices to the CFO block and set its lookback.
- Connect CFO and a zero reference to a crossover block. Verify the crossing direction on historical candles.
- Add an EMA block and compare closing price with its output.
- Pass the EMA through a five-candle Lag block. Compare the current EMA with that earlier value.
- Combine the entry conditions with an AND condition block and a flat-position check.
- Connect the result to a buy action block that sends a signal under your rules.
- Add the CFO exit and protective threshold independently of the entry conditions.
Inspect several entries and exits candle by candle. Check a clean recovery, a failed recovery and repeated near-zero crossings. Verify the block’s sign convention against the underlying values.
Then compare the baseline and variants on separate test periods. No live deployment is required for this research.
If you later choose deployment, your rules signal your own exchange account. The exchange decides whether to accept and execute. Arrow Algo supplies the software for constructing your algorithm.
What Should You Keep From This CFO Test?
- CFO measures deviation from a regression reference; it does not promise a future price.
- A fresh crossing differs from an indicator simply remaining positive.
- Separate trend direction, entry timing and exit logic.
- Test buffers and filters individually, including their missed opportunities.
- Verify calculation conventions, completed candles and realistic costs before judging the results.
Disclaimer: This content is for educational purposes only and does not constitute financial advice. Trading involves significant risk and you should only trade with capital you can afford to lose. Past performance is not indicative of future results. Always conduct your own research before making any trading decisions.
Ready to build your own automated trading strategies without writing a single line of code? Start for free at Arrow Algo and join thousands of traders who've made the switch to systematic trading.