
Crypto Market Update Monday October 19, 2026: Bitcoin at $82,438 (+0.39%)
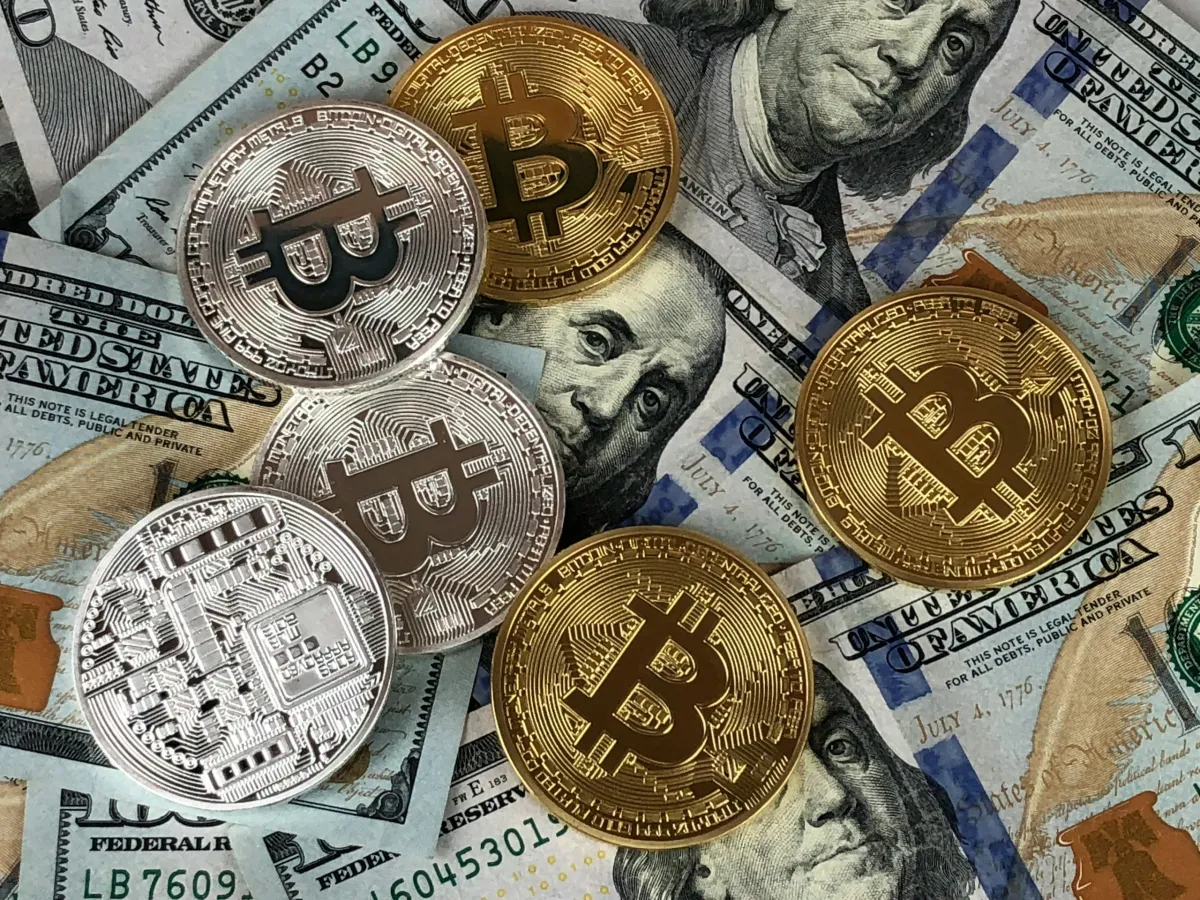
This Monday crypto market update opens with Bitcoin at $82,438, up 0.39% since the daily open. The weekend was quiet. Bitcoin never lost $80,000, and the week starts with risk appetite returning. Alternative.me’s Fear & Greed Index reads 59, Greed. It read 53 on Sunday and 63 on Friday. CoinMarketCap’s separate index reads 49, Neutral.
Snapshot: 19 October 2026, approximately 10:56 UTC / 11:56 BST. Crypto prices use Binance USDT pairs, shown in dollar terms. All daily crypto changes below start at midnight UTC. They are not rolling 24-hour returns.
Crypto Market Update: Key Movers Today
Majors are modestly higher. The smaller altcoins are lagging, with Cardano the weakest of the group.
| Asset | Price | Since 00:00 UTC | 24h | Today’s high |
|---|---|---|---|---|
| Bitcoin | $82,438 | +0.39% | +0.38% | $83,158 |
| Ethereum | $2,427 | +0.70% | +0.26% | $2,446 |
| Solana | $104.97 | +0.83% | +0.89% | $106.22 |
| XRP | $1.306 | -0.13% | +0.49% | $1.322 |
| BNB | $725.27 | +0.26% | +0.28% | $729.49 |
| Cardano | $0.2187 | -1.13% | -0.95% | $0.2229 |
Ether’s seven-day range is $2,318–$2,539. It is down 0.8% over the week. Solana has held above $100 since Thursday’s bounce. Bitcoin is up 0.7% over seven days, so last week’s volatility netted out to almost nothing.
CoinDesk reports that DeFi tokens led the altcoin gains overnight. Two institutional headlines are worth noting. Bloomberg says JPMorgan’s JPM Coin is coming to Ethereum. CME is launching Bitcoin Cash and Uniswap futures this week.
ETF Flows Turned Positive on Friday
US spot Bitcoin ETFs took in $175.7 million on Friday 17 October. Fidelity’s FBTC led with $103.1 million. BlackRock’s IBIT added $65.9 million. That reversed Thursday’s $82.39 million outflow, which was mostly IBIT. Crypto Briefing has the Thursday figures.
One strong day does not fix the month. October’s net Bitcoin ETF flow was still roughly $535 million negative at mid-month. September brought in about $2.6 billion. US spot Ether ETFs lost $69.68 million on Thursday. Friday’s inflow is a good sign. It is not yet a trend. The full tables are at Farside Investors.
Macro Context: China GDP Beat and Cheaper Oil Lift Risk
Friday was ugly on Wall Street. The S&P 500 fell 1.1% to 7,659. The Nasdaq dropped 2.1% to 26,140. The Dow lost 0.3% to 52,002. For the week, the S&P 500 fell 1.9% and the Nasdaq 4.5%. Both posted their worst week since June. Yahoo Finance has the recap.
The sell-off had two causes. Investors questioned whether debt-heavy AI infrastructure firms can earn enough to repay what they have borrowed. Oil also jumped on reports of tanker incidents in the Strait of Hormuz. The VIX rose 21.5% to close at 19.99, its biggest one-day jump since June.
Monday has started differently. China’s third-quarter GDP grew 4.5% year on year, up from 4.3% in the second quarter. Retail sales rose 1.1% against a 0.5% forecast. Nasdaq futures are up more than 1%. South Korea’s Kospi gained 1.8% to 5,768. The Nikkei 225 is the exception at 64,917, down 0.62%, as Tokyo Electron and SoftBank fell.
Oil Falls on the Russia Sanctions Waiver
Oil is down more than 2% after President Trump waived sweeping sanctions on Russia, including on Russian energy. Yahoo’s futures quotes show Brent at $108.53, down 1.21%, and WTI at $98.12, down 3.24%. Cheaper oil is the main reason risk assets are bid this morning.
Bond yields are steady. The 10-year US Treasury yield is 5.07%, down one basis point. The 30-year yield is 5.41%. The 2-year note yields 4.73%. Trading Economics tracks the levels. There has been no relief at the long end since Wednesday’s hot CPI print.
Gold futures are flat at $4,183. Silver futures are $57.62, up 1.09%. London’s FTSE 100 is at 10,780, down 0.94%. Sterling is at $1.333, up 0.47%.
The US index levels above are Friday’s closes. US markets had not opened when this snapshot was taken. Macro percentage changes compare with the previous session close. Futures quotes are not spot prices.
What Does the Technical Picture Show?
Bitcoin’s seven-day range is $79,800–$84,168. Price sits in the upper half. Friday’s full-day low was $80,809. The weekend low was $80,684 on Sunday evening. The second test of $79,800 that Friday’s update warned about never came.
The weekend confirmed one thing. Bitcoin’s own volatility index slipped to under 40%, according to CoinDesk. Equities panicked on Friday. Bitcoin did not.
The levels to watch today:
- $83,158: today’s high. A clean break opens the path to the weekly ceiling.
- $84,168: the seven-day high. Bitcoin has not closed above it in this range.
- $80,684: the weekend low. Losing it would put $79,800 back in play.
- $79,800: the seven-day low from Thursday’s flush.
Is the Equity Scare Over?
CoinDesk’s data point is useful. Of 32 previous Friday VIX spikes of 20% or more, the index fell on the following Monday 25 times. The average Monday drop was 4.5%. That favours a calmer session. It does not guarantee one. US earnings season is in full swing, and the end-of-month Fed meeting is approaching.
What Algorithmic Traders Are Watching
- Weekend range held: Bitcoin stayed inside $80,000–$83,500 for three days. Strategies that trade range extremes had a clean weekend. Breakout rules had nothing to do.
- Flow reversal: Friday’s $175.7 million inflow is the first meaningful positive print in a week. One print is not a signal. Two or three in a row would be.
- Correlation check: Bitcoin ignored Friday’s equity drop. If your strategy uses an equity filter, review whether it is still earning its place.
Watch the Close, Not the Wick
- $83,158 test: a wick through today’s high on Nasdaq futures strength is likely. A candle close above it is a different event. Our candle close confirmation guide explains why the distinction matters for systematic rules.
- Oil sensitivity: risk appetite is tracking crude this week. A reversal in oil would hit equities first and crypto second.
Crypto Market Update: What Is the Market Outlook?
The near-term bias is cautiously positive. A floor that held without a retest, a quiet weekend and a flow reversal all point the same way. The test is $83,158 and then $84,168. A daily close above the weekly high would be the first real breakout since the range formed.
The downside risk is a repeat of Friday’s AI-stock rotation during US hours. If that pulls Bitcoin back below the $80,684 weekend low, $79,800 returns as the level to defend.
This week brings global PMI data and a heavy earnings calendar. Treat Monday’s calm as a starting point, not a conclusion.
Disclaimer: This content is for educational purposes only and does not constitute financial advice. Trading involves significant risk and you should only trade with capital you can afford to lose. Past performance is not indicative of future results. Always conduct your own research before making any trading decisions.
Ready to build your own automated trading strategies without writing a single line of code? Start for free at Arrow Algo and join thousands of traders who've made the switch to systematic trading.