
Donchian Channel Breakout Strategy: How to Build It in Arrow Algo
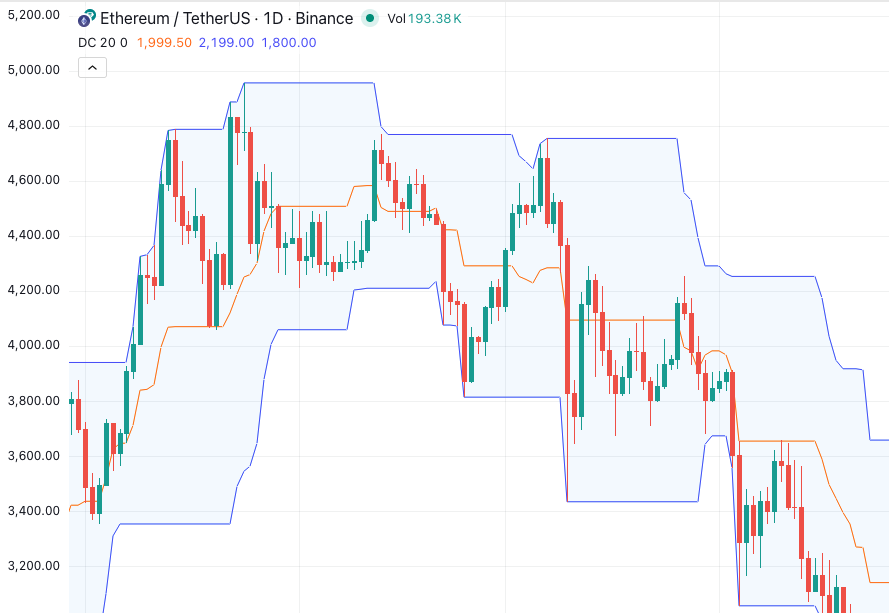
The Donchian channel breakout strategy is the purest expression of trend following ever put on a chart: buy when price makes a new N-period high, exit when it makes a new N-period low. No formula, no smoothing, no settings debate — just the highest high and lowest low of the lookback window. It is the system Richard Dennis taught his famous Turtle traders in the 1980s, and it remains the cleanest starting point for anyone building their first breakout algorithm.
What Is a Donchian Channel Breakout Strategy?
Richard Donchian’s channel draws three lines: the upper band at the highest high of the last N periods, the lower band at the lowest low, and a midline between them. A Donchian channel breakout strategy trades the touches. Price printing a new 20-day high means buyers just paid more than anyone in a month — the definition of emerging strength. The strategy buys that strength and rides it until weakness proves itself with a fresh multi-period low.
The logic is deliberately dumb, in the best way. Trends must, by definition, make new highs. A breakout system never misses a major trend, because entering on new highs is the only way it knows how to act.
How Is the Channel Constructed?
There is genuinely nothing more to it, as Investopedia confirms: upper band = highest high of N periods, lower band = lowest low of N periods. The channel widens in volatile markets and narrows in quiet ones. A narrowing channel is itself information — compression that often precedes the next expansion. Because the bands are raw price extremes rather than averages, they never lag in the usual sense: the moment price exceeds the band, the band moves with it.
Why Do Channel Breakouts Work?
Three reasons keep this fifty-year-old idea alive. First, trends persist: markets that make new highs tend to keep making them, which is the empirical core of all breakout trading. Second, the entry is unambiguous — there is no interpretation, which makes it perfectly suited to automation. Third, the exit is built in: the opposite band provides a trailing stop that gives trends room while capping disasters. The catch is the win rate. Breakout systems typically win 35-45% of the time and make their money on a few large trends — which means long losing streaks are a design feature, not a defect.
The Classic Rule Set
The 20/10 Breakout
- Entry: price breaks above the 20-period upper band — go long.
- Exit: price breaks below the 10-period lower band. The shorter exit window locks in profits before a full trend reversal.
- Character: responsive, more trades, catches medium swings.
The 55/20 Variant
- Entry: a 55-period high — the Turtles’ filter for only the largest trends.
- Exit: a 20-period low.
- Character: rare signals, long holds, designed to catch the one move a year that pays for everything. The full system, including its volatility-based position sizing, is covered in our Turtle trading strategy guide.
Building the Breakout in Arrow Algo
- Add a Donchian Channels block and connect your candle feed — the period is an editable property.
- Use a crossover block to detect price crossing above the upper band. That is the entire entry signal.
- Add a second, shorter-period Donchian block and route price crossing its lower band to your exit.
- Optionally add an ATR-based position size so volatile markets get smaller trades — the Turtles’ other secret.
- Backtest across several pairs on live exchange data from Binance, Coinbase, or HyperLiquid. Breakout systems live or die by the trends in the data, so test full cycles, not cherry-picked months.
What Goes Wrong in Practice?
- False breakouts in ranges. Sideways markets produce marginal new highs that immediately fail. Expect them — the strategy’s math already accounts for many small losses.
- Quitting during the drawdown. The most common failure is human: abandoning the system during a normal streak of failed breakouts, right before the trend that pays. Automation exists precisely for this.
- Over-shortening the lookback. A 5-period channel on crypto noise generates constant whipsaw. The classic 20 and 55 settings have survived four decades for a reason.
- Ignoring costs. Breakout entries buy strength, so fills are at highs and slippage works against you. Model realistic fees in the backtest.
What Matters Most?
- The Donchian channel breakout strategy buys new N-period highs and exits on new lows — trend following at its simplest.
- It never misses a major trend, and pays for that guarantee with a sub-50% win rate and inevitable streaks of small losses.
- The 20/10 and 55/20 rule sets remain the standards; robustness beats clever settings.
- The channel’s opposite band doubles as a built-in trailing exit.
- Arrow Algo’s Donchian block turns the whole system into a few visual blocks — see the complete Donchian channels guide for the indicator’s full background.
Disclaimer: This content is for educational purposes only and does not constitute financial advice. Trading involves significant risk and you should only trade with capital you can afford to lose. Past performance is not indicative of future results. Always conduct your own research before making any trading decisions.
Ready to build your own automated trading strategies without writing a single line of code? Start for free at Arrow Algo and join thousands of traders who’ve made the switch to systematic trading.