
Donchian Channels: Complete Guide for Algorithmic Trading
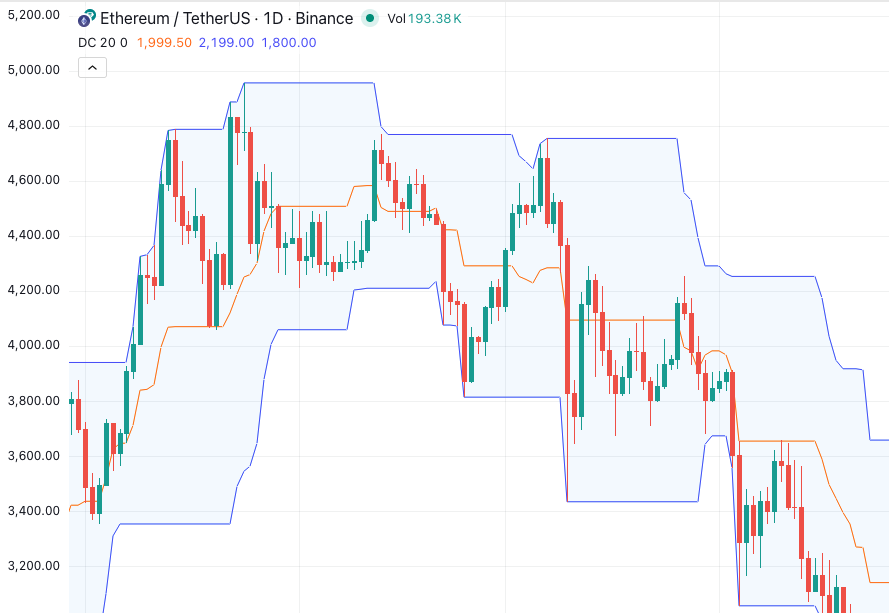
When traders talk about breakout systems and channel-based strategies, Donchian Channels are almost always part of the conversation. Developed by Richard Donchian — widely regarded as the father of trend following — Donchian Channels are one of the oldest and most enduring tools in systematic trading. They formed the foundation of the famous Turtle Trading experiment of the 1980s, and they remain a core building block for breakout strategies today. For algorithmic traders, Donchian Channels offer something rare: a simple, rules-based signal that is transparent, objective, and straightforward to automate.
What Are Donchian Channels?
Donchian Channels are a price envelope indicator that plots three lines on a chart, derived entirely from recent price highs and lows over a defined lookback period:
- Upper Band — the highest price reached over the last N periods
- Lower Band — the lowest price reached over the last N periods
- Middle Line — the average of the upper and lower bands
The most commonly used setting is 20 periods, which captures approximately one month of daily price action. Shorter periods (10–14) create a more reactive, narrower channel suited to faster strategies. Longer periods (55–100) produce wider channels used for capturing major macro trends — this was the setting favoured by the Turtle Traders according to Investopedia. The story of how Richard Dennis proved trend following could be taught remains one of the most famous experiments in trading history.
How Are Donchian Channels Calculated?
The calculation is deliberately simple — one of Donchian’s key principles was that effective trading rules should be easy to understand and apply consistently:
- Select your lookback period (e.g. 20 days)
- Upper Band = the single highest closing or intraday high over those 20 periods
- Lower Band = the single lowest closing or intraday low over those 20 periods
- Middle Line = (Upper Band + Lower Band) ÷ 2
As each new price bar closes, the oldest bar drops out and the newest bar is added. If the new bar sets a new 20-period high, the upper band moves up immediately. If it sets a new 20-period low, the lower band moves down. The channel expands during volatile, trending conditions and contracts during quiet, ranging periods.
How to Read Donchian Channel Signals
Breakout Signals
The primary signal from Donchian Channels is a channel breakout:
- Bullish breakout — price closes above the upper band. The asset has just reached a new N-period high, suggesting upward momentum is building. This is a potential long entry signal.
- Bearish breakout — price closes below the lower band. The asset has just set a new N-period low, suggesting downward momentum. This is a potential short entry signal.
Middle Line as a Trend Filter
The middle line acts as a dynamic support and resistance level. Price trading above the middle line generally indicates a bullish environment; price below the middle line suggests bearish conditions. Many traders use this as a filter — only taking long trades above the middle line and short trades below it.
Channel Width as a Volatility Signal
The distance between the upper and lower bands reflects recent volatility. A narrow Donchian Channel means the asset has been trading in a tight range — often preceding a significant breakout in either direction. A wide channel indicates a strongly trending or highly volatile asset.
What Are the Best Donchian Channel Strategies?
1. The Classic 20-Period Breakout
This is the strategy that made Donchian Channels famous. Enter long when price closes above the upper band. Hold the position until price closes below the lower band, which serves as the exit signal. This approach captures strong sustained trends and naturally exits when the trend reverses. It works best in trending markets and will produce losses in choppy, range-bound conditions — which is why many traders pair it with a trend filter.
2. The Dual-Channel System (Turtle Trading Method)
Richard Dennis and William Eckhardt’s Turtle Trading system used two Donchian Channel settings simultaneously:
- A 20-period channel for entries — take a long position on a 20-day breakout
- A 10-period channel for exits — close the position when price breaks the shorter-term lower band
The logic is that entries should capture new significant trends (20 days), while exits should be responsive to trend deterioration (10 days). This asymmetric approach lets positions run longer while cutting losses relatively quickly.
3. Middle Line Mean Reversion
In ranging markets, price tends to oscillate between the bands and revert to the middle line. A contrarian approach enters long when price touches the lower band and targets the middle line, and enters short when price touches the upper band targeting the middle line. This strategy performs poorly in trending conditions and requires a clear regime filter to identify when the market is ranging versus trending.
What Are Common Donchian Channel Mistakes to Avoid?
- Using Donchian Channels without a trend filter in ranging markets. A pure breakout system will get chopped up repeatedly in sideways conditions. Pairing Donchian Channels with an ADX reading above 25, or only trading breakouts when the 200-period moving average slope is positive, significantly improves performance.
- Over-optimising the lookback period. Backtesting to find the “perfect” period for a specific asset produces results that rarely carry forward. The 20-period default exists because it captures approximately one month of conditions across most markets — it is a robust starting point.
- Taking every breakout signal. Not every new 20-period high is worth trading. Volume confirmation — checking that the breakout is accompanied by above-average volume — filters out many false signals.
- Ignoring the exit. The Donchian Channel gives a clear exit rule. Many traders override it manually, holding past the lower band break because they “feel” the trend will continue. This is exactly the type of emotional decision that systematic trading is designed to eliminate.
Building Donchian Channel Strategies in Arrow Algo
Arrow Algo’s visual block builder makes it straightforward to construct and backtest a complete Donchian Channel breakout system without writing any code. Using the drag-and-drop interface you can:
- Add a Donchian Channel block and set your desired period (default 20) directly in the settings panel — the upper band, lower band, and middle line are all available as separate output values
- Create an Entry Condition block that triggers a long position when the current closing price crosses above the upper band value
- Add a second Donchian Channel block with a shorter period (e.g. 10) and connect its lower band output to an Exit Condition block — replicating the Turtle Trading dual-channel approach visually
- Add an ADX filter block to restrict entries to trending conditions only (ADX above 25), reducing false breakout signals in ranging markets
- Run the complete system through backtesting across your chosen exchange data to see how the strategy would have performed across different market regimes before committing any capital
- Adjust the period, add a volume confirmation condition, or test the mean-reversion variant — all without touching code, directly in the visual builder
The Donchian Channel’s transparency is one of its great strengths for systematic trading: every signal has a clear, mathematical reason. There is no ambiguity about whether a breakout has occurred — the upper band is a specific number, and price is either above it or it isn’t.
What Are the Key Takeaways?
- Donchian Channels plot the highest high, lowest low, and midpoint over a lookback period (default: 20)
- A close above the upper band is a bullish breakout signal; a close below the lower band is bearish
- The Turtle Trading system used a dual-channel approach — 20-period for entries, 10-period for exits
- Channel width reflects recent volatility; narrow channels often precede significant breakouts
- Pair with an ADX or moving average filter to avoid false signals in ranging conditions
- Arrow Algo’s visual block builder lets you automate the full system and backtest it before going live
Educational disclaimer: This content is for educational purposes only and does not constitute financial advice. Trading involves significant risk and you should only trade with capital you can afford to lose. Past performance is not indicative of future results.
Disclaimer: The information provided in this article is for educational purposes only and does not constitute financial advice. Trading involves significant risk and you should only trade with capital you can afford to lose. Past performance is not indicative of future results. Always conduct your own research before making any trading decisions.
Ready to build your own Donchian Channel breakout strategy without writing a single line of code? Start for free at Arrow Algo and put one of the most proven systematic strategies to work for you.