
Double EMA Trading Strategy: How to Build It in Arrow Algo
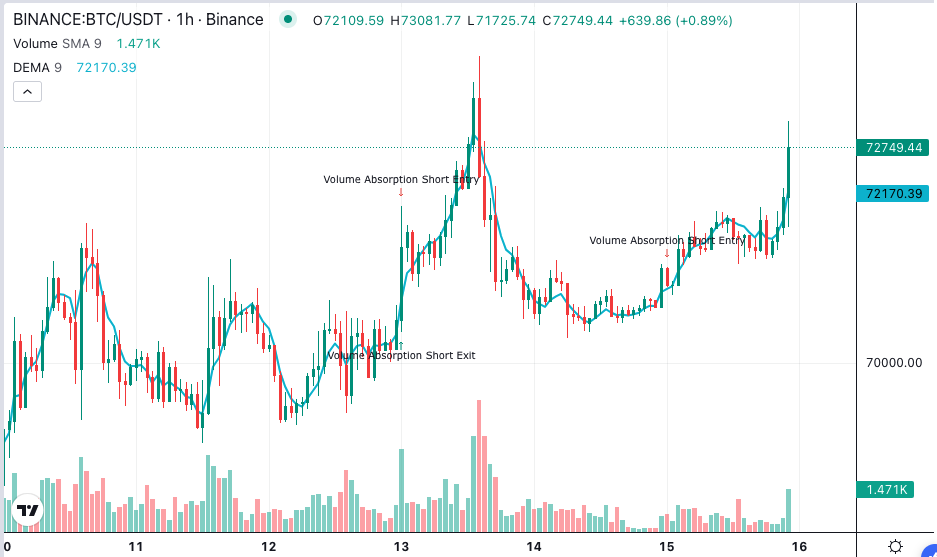
A Double EMA trading strategy is built to fix the one complaint every moving average trader has: the signal arrives late. The Double Exponential Moving Average, or DEMA, was designed by Patrick Mulloy in 1994 to cut that lag roughly in half without adding noise. Some traders use “double EMA” to mean two ordinary EMAs crossing. This post covers the DEMA indicator, and the first strategy below uses two of them crossing, so both readings are served. Our DEMA guide covered the maths. Here the focus is on rules you can backtest.
What Does a Double EMA Do Differently?
An ordinary EMA smooths price by weighting recent candles more heavily. The smoothing is what makes it useful, and the smoothing is what makes it late. A 20-period EMA sits several candles behind the price it is tracking.
The DEMA takes that EMA and applies a correction. It calculates an EMA of the EMA, which is even smoother and even later. Then it takes the original EMA, doubles it, and subtracts the smoothed version. The effect is to push the line back towards price. The lag that the second smoothing exposes is subtracted out. Investopedia’s DEMA entry has the formula if you want it.
In practice, a 20-period DEMA hugs price about as closely as a 10-period EMA while staying as smooth as a 20. That is the trade. You get the responsiveness of a short average with the stability of a longer one.
Why Lag Is the Problem a DEMA Solves
Every moving average strategy pays for lag twice. The entry comes after the move has started. The exit comes after the move has ended. On a trend that runs for weeks, those two costs are small next to the gain in the middle. On a trend that runs for three days, they can be the whole trade.
Shortening the EMA period is the obvious fix. It also multiplies the false signals, because a short EMA reacts to every wobble. The DEMA is the alternative. It keeps the period, and therefore the noise filtering, but reduces the delay. For a trend-following strategy on a 4-hour or daily chart, that often means catching the same trends two or three candles earlier and leaving them two or three candles sooner.
That is the whole argument for a Double EMA trading strategy. Same signals, less lag, roughly the same noise.
Three Double EMA Strategies to Backtest
DEMA crossover
Two DEMAs, one fast and one slow. Go long when the fast crosses above the slow. Exit, or go short, when it crosses back below. A 10 and 30 pairing is a sensible start on the 4-hour chart. The classic EMA crossover uses the same structure. Swapping both EMAs for DEMAs produces earlier crosses. In most backtests the DEMA version has slightly more trades and a slightly larger average winner. Whether the extra trades are worth it depends on fees and the pair.
DEMA pullback in a trend
One DEMA, period 50, as the trend line. Only trade long when price is above it. Wait for price to pull back and touch the DEMA, then close back above it. That close is the entry. The stop goes below the pullback low. The exit is a close below the DEMA. This is a classic pullback entry, and the DEMA suits it because the line sits closer to price than an EMA would. Pullbacks reach it more often and the stop is tighter.
DEMA slope with an ADX filter
Use the direction of the DEMA, not its position. Compare today’s DEMA value with the value five candles ago. If it is higher, the slope is up. Trade long only when the slope is up and the 14-period ADX is above 25. Exit when the slope turns down. This version ignores crossovers entirely. It tends to hold through small pullbacks that would stop out a crossover system, because a brief dip in price does not flip the slope of a 50-period line.
Which Periods Work for a DEMA?
The DEMA is already fast. Resist the urge to make it faster. A 20-period DEMA behaves like a 10-period EMA. Setting the DEMA to 5 produces a line that is almost price itself, and a strategy built on it will trade constantly.
For crossovers, a fast DEMA between 8 and 12 and a slow one between 25 and 35 covers the useful range. For pullback and slope strategies, 40 to 60 is the zone. Longer than that, and you have given back the lag advantage the indicator exists to provide.
Timeframe matters more than period. The DEMA’s reduced lag is most valuable where trends are short relative to the candle size. On the daily chart, trends in major crypto pairs often last long enough that an EMA does the job. On the 1-hour and 4-hour charts, the DEMA’s head start is worth more.
When Does a Double EMA Strategy Break Down?
Ranging markets. Less lag means the DEMA follows price into the range and out of it on every swing. A crossover system in a range will fire constantly. The ADX filter in the third strategy exists for this reason. Without a trend filter, expect the DEMA crossover to lose more in ranges than the EMA version does.
Overshoot. The DEMA’s correction can push the line past where price is heading. On a sharp reversal, the DEMA sometimes turns before the move is finished and then turns back. Confirmation closes, waiting one extra candle, reduce this at the cost of some of the lag advantage.
Treating it as a support line. The DEMA is a smoothed price. It is not a level the market defends. Pullback entries work because of the trend, not because the line itself has any meaning to other traders.
Period scanning. Testing every pairing from 5 to 50 and picking the best is overfitting. Choose a pairing, test it on five pairs, and change it only if all five disagree with you.
How to Build a Double EMA Trading Strategy in Arrow Algo
Arrow Algo’s visual builder includes a DEMA block with a single period input. The crossover strategy needs four blocks.
- Add two DEMA blocks. Set one to 10 and the other to 30.
- Add a Crossover block. Connect the fast DEMA to the first input and the slow DEMA to the second. It fires when the fast line crosses above the slow.
- Add a second Crossover block with the inputs reversed for the exit.
- Connect each Crossover to its order block.
For the pullback version, use one DEMA block set to 50, a condition that the close is above the DEMA, and a Lag block on the close to check the previous candle was below it. Feed both conditions into a condition block set to AND. For the slope version, add a Lag block on the DEMA output with a lag of five, and a condition comparing the current DEMA to the lagged one. An ADX block with a condition above 25 completes the filter.
Run the backtest on at least two years of data across several pairs. Compare the DEMA version against the same strategy with plain EMAs. If the DEMA is not clearly better on most pairs, the extra responsiveness is not helping on your timeframe.
What to Remember Before You Backtest
- The DEMA cuts moving average lag roughly in half by subtracting a smoothed copy of the EMA from a doubled EMA.
- A 20-period DEMA tracks like a 10-period EMA but filters noise like a 20.
- Three strategies to test: a two-DEMA crossover, a pullback to a 50-period DEMA, and a DEMA slope with an ADX filter.
- Keep the periods sensible. The indicator is already fast.
- Add a trend filter. Reduced lag is a liability in a range.
- Build it in Arrow Algo with the DEMA, Crossover, Lag and condition blocks, and compare it directly against the EMA version.
Disclaimer: This content is for educational purposes only and does not constitute financial advice. Trading involves significant risk and you should only trade with capital you can afford to lose. Past performance is not indicative of future results. Always conduct your own research before making any trading decisions.
Ready to build your own automated trading strategies without writing a single line of code? Start for free at Arrow Algo and join thousands of traders who've made the switch to systematic trading.