
Elder Force Index Pullback Strategy: How to Build It in Arrow Algo
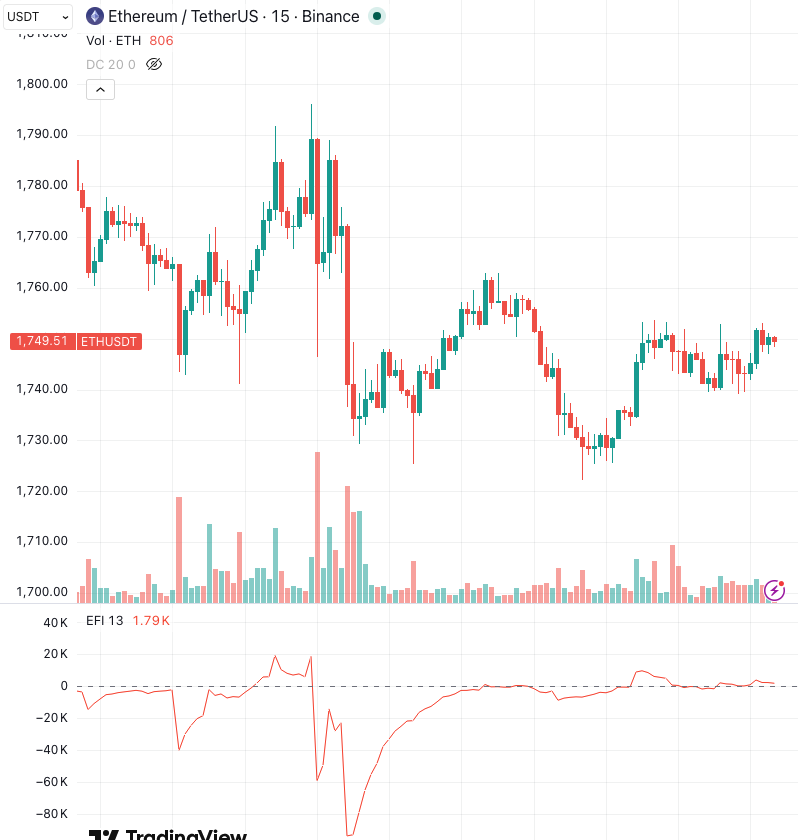
An Elder Force Index pullback strategy looks for temporary selling inside an established uptrend. The Elder Force Index, or EFI, combines closing-price changes with volume. A short negative reading identifies the pullback. A recovery through zero supplies a possible entry trigger.
The challenge is separating a pause from a failing trend. This guide builds a testable example around that distinction. The settings below are research starting points, with no backtested performance claimed.
What Makes an Elder Force Index Pullback Strategy Different?
EFI is a volume-weighted momentum oscillator. It moves above and below zero instead of following a fixed scale.
Price can fall briefly during a broader advance. A fast EFI reading may turn negative during that interruption. Waiting for its recovery creates a different entry rule from buying every negative reading.
TradingView’s EFI documentation describes these corrections within a larger trend. Our original Elder Force Index guide covers the indicator more broadly.
The example here requires three things: an upward trend, a negative EFI reading, and a subsequent recovery. None proves that the next trade will succeed. Together, they make the hypothesis specific enough to test.
How Does EFI Turn Price and Volume Into a Reading?
Start with the current closing price. Subtract the previous candle’s close. Multiply that difference by the current candle’s volume.
A higher close produces a positive raw reading. A lower close produces a negative reading. Greater volume increases the magnitude for the same price change.
An exponential moving average then smooths those raw readings. A short smoothing period reacts quickly. A longer period usually changes direction less often.
EFI has no universal overbought or oversold threshold. Its scale depends on the instrument, price units and volume feed. A fixed number copied between two markets can therefore mean very different things.
Use zero as the directional reference in this example. Keep the exchange, pair and volume source consistent throughout testing.
Which EFI Signals Identify the Pullback and Recovery?
Separate the trend filter from the entry trigger. A moving average can describe the broader direction. Fast EFI then identifies a shorter interruption within that direction.
For this example, require the close to sit above a 50-period exponential moving average. Also require that average to exceed its value five completed candles earlier.
Next, wait for two-period EFI to cross from below zero to above zero. Evaluate these conditions on completed candles.
A crossing is an event. Being above zero is a continuing state. Confusing them can produce repeated entry signals throughout the same advance.
The two-period setting deliberately reacts quickly. It can also produce frequent false starts. Keep it only if testing supports the additional turnover and costs.
Which Pullback Variations Are Worth Comparing?
Start With the Zero-Crossing Baseline
Use the trend filter and positive EFI crossing together. Allow one position at a time. Reject the setup when the trend filter fails at the signal candle’s close.
This version needs no subjective judgement about whether a dip looks attractive. It also makes the main weakness visible: repeated crossings during sideways movement.
Require Broader Volume Support
As a separate experiment, add a slower EFI reading with a period of 13. Require that reading to remain positive.
The hypothesis is that short-term selling occurs inside broader positive volume-weighted momentum. The extra condition may remove useful entries along with poor ones. Compare the change in trade count, costs and drawdown.
Add a Price-Recovery Condition
Another variant requires the signal candle to close above the previous candle’s high. This adds price confirmation to the EFI recovery.
It can delay entry and increase the distance to a protective exit. Test it separately from the slower-EFI filter. Combining every filter immediately makes the contribution of each change harder to understand.
Where Should the Example Exit and Risk Rules Sit?
The entry does not define the whole strategy. Specify the exit, sizing rule and repeat-entry behaviour before comparing results.
One research baseline uses a protective exit two average true ranges below entry. Average true range measures recent price movement. Freeze that initial distance at entry for this comparison.
Add a separate trend exit when a completed candle closes below the 50-period average. Keep entry filters away from protective exits. A failed trend condition should never prevent an already-defined risk exit.
| Component | Illustrative setting | Purpose |
|---|---|---|
| Chart interval | Four hours | Define one consistent observation unit |
| Trend average | 50-period EMA | Describe broader direction |
| Slope comparison | Five candles earlier | Reject a falling average |
| Fast EFI | Two periods | Detect the pullback recovery |
| Initial risk distance | Two 14-period ATRs | Adjust distance to recent movement |
Choose position size from a predefined loss budget and the initial risk distance. Fees, slippage and gaps can increase losses. A stop price is not a guaranteed fill price.
Which Mistakes Can Distort an EFI Pullback Test?
Treating volume as a complete market picture. One exchange’s volume describes that venue. It does not capture every spot and derivatives market.
Buying every negative reading. EFI can remain negative through an extended decline. The trend filter and recovery event serve different purposes.
Using unfinished candles. Price and volume keep changing during the candle. An apparent crossing can disappear before the close.
Avoid Hidden Changes to the Experiment
Comparing mismatched tests. Keep dates, fees, sizing and exit assumptions unchanged when testing an entry filter.
Selecting one lucky period. Try a small neighbouring set, such as EFI periods two, three and four. These are sensitivity checks, not recommended optimal settings.
Reporting only profit. Examine drawdown, trade count and losing sequences. Drawdown means the decline from a previous account peak. A higher return may involve a much harder path.
Keep a later period untouched for a final check. QuantConnect’s research guide explains why repeated testing can overfit historical data.
How Can You Build the Elder Force Index Pullback Strategy in Arrow Algo?
Use the drag-and-drop visual builder to express each condition explicitly. Arrow Algo provides software for building your own algorithms.
- Add a Data Watcher for one exchange, pair and timeframe.
- Connect its close and volume outputs to an EFI block. Set the smoothing period to two.
- Feed closing prices into an EMA block with a period of 50.
- Use a Lag block to compare that EMA with its value five candles earlier.
Connect the Trigger and Review the Behaviour
- Create conditions for price above the EMA and the EMA above its lagged value.
- Compare EFI against a fixed zero value through a Crossover block.
- Combine the trend conditions and upward crossing with a Condition block set to AND.
- Connect the result to a buy action block. Configure exits and single-position behaviour before running a backtest.
Inspect individual signals to confirm completed-candle evaluation and prevent repeated entries. Check that your risk settings match the distance and sizing assumptions used in the test.
Action blocks send buy and sell signals. If you choose to deploy, your rules signal your own exchange account. The exchange decides whether to accept and execute those instructions.
What Should You Retain From This Pullback Method?
- An Elder Force Index pullback strategy separates the broader trend from a shorter interruption.
- A negative-to-positive crossing creates a specific recovery event.
- Fast EFI settings need careful checks for false starts and costs.
- Test added confirmation rules individually against the same baseline.
- Define exits and sizing before judging entry quality.
- Treat every example setting as a hypothesis requiring independent validation.
Disclaimer: This content is for educational purposes only and does not constitute financial advice. Trading involves significant risk and you should only trade with capital you can afford to lose. Past performance is not indicative of future results. Always conduct your own research before making any trading decisions.
Ready to build your own automated trading strategies without writing a single line of code? Start for free at Arrow Algo and join thousands of traders who've made the switch to systematic trading.