
EMA Ribbon Strategy: How to Build It in Arrow Algo
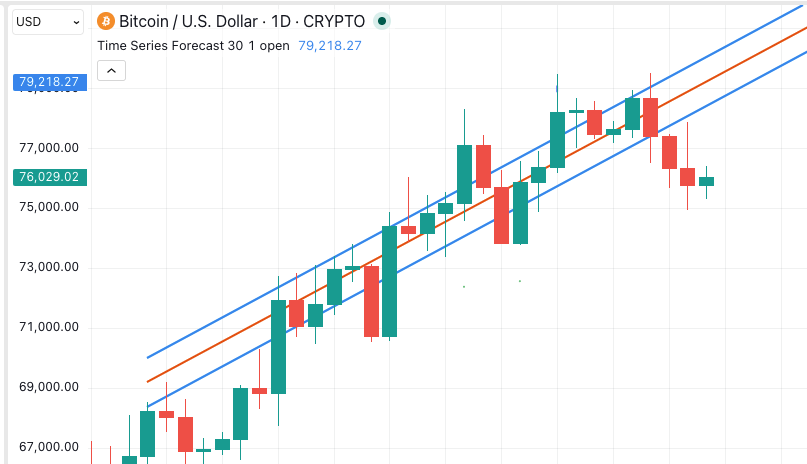
The EMA ribbon strategy uses a series of Exponential Moving Averages plotted simultaneously — typically five to eight EMAs of increasing periods — to reveal not just the direction of a trend, but how strong and how mature it is. Where a single EMA tells you which way price is moving, the ribbon tells you whether that move has conviction behind it.
What Makes the EMA Ribbon Strategy Work?
A single Exponential Moving Average gives you one data point: is price above or below a smoothed average? A ribbon gives you a gradient. When five or more EMAs are stacked in order — each faster one above the next slower one in an uptrend — the spread between them reflects the intensity of directional momentum.
The logic is straightforward. In a strong uptrend, shorter-period EMAs accelerate faster than longer-period ones. They fan out above the slower averages, creating a wide, ordered ribbon. As a trend weakens, the faster EMAs slow down and begin converging toward the slower ones. The ribbon compresses. When momentum reverses, the faster EMAs cross below — and the ribbon flips.
How to Set Up an EMA Ribbon
A standard ribbon uses five or more EMAs covering short, medium, and long periods. A commonly used setup covers periods 8, 13, 21, 34, and 55 — spaced to give clear visual separation between trend phases. Another popular configuration uses 10, 20, 30, 40, and 50.
The exact periods matter less than the principle: spread them enough to distinguish between fast, medium, and slow trend behaviour. Too tightly spaced and the ribbon shows noise. Too widely spaced and it reacts too slowly to be actionable.
All EMAs use the closing price as their input. The ribbon is plotted on the price chart, not in a separate panel — the visual relationship between the ribbon and price is part of the signal.
Reading EMA Ribbon Signals
Ordered and fanning: All EMAs stacked in sequence — fastest on top in an uptrend, slowest on bottom — with the gaps between them widening. This is the highest-conviction trending state. Trend-following entries are valid; the move has momentum behind it.
Ordered but compressing: The EMAs are still in correct sequence but the gaps between them are narrowing. The trend is intact but losing momentum. Tighten stops. Avoid new entries until the ribbon re-expands or confirms direction.
Tangled or crossing: Multiple EMAs are interlaced or crossing each other. The market is in a ranging or transitional phase. Trend-following signals from this ribbon state have low reliability. Wait for the ribbon to resolve into an ordered structure before trading direction.
Flipped and re-ordering: The ribbon has reversed — faster EMAs are now below the slower ones in what was an uptrend. This is the ribbon confirming a bearish shift. The transition from tangled to ordered-bearish is the entry signal for short or exit positions.
EMA Ribbon Trading Rules
Trend-following entry: Enter when the ribbon is fully ordered and fanning. Use a pullback to the fastest EMA in the ribbon — rather than chasing price — to improve entry timing. The fastest EMA acts as dynamic support in a healthy uptrend. Exit when the ribbon begins to compress significantly or the fastest EMA crosses below the second fastest. For a comparison with simpler crossover approaches, see our post on the EMA Crossover Strategy.
Reversal detection: When the ribbon transitions from ordered-bullish to tangled, close or reduce long positions. When the ribbon re-orders in the bearish direction — with all faster EMAs below slower ones — that is the reversal confirmation. The ribbon transition takes longer than a single crossover to confirm, but it produces fewer false positives in doing so.
Ranging market filter: When the ribbon is tangled, switch off trend-following signals entirely. A tangled ribbon is an explicit signal that trend-following logic should not be active. This is the ribbon’s built-in regime filter — it communicates ranging conditions directly through its visual structure.
What Are Common EMA Ribbon Mistakes?
Trading inside a tangled ribbon: Entering trend-following positions while multiple EMAs are interlaced is the most common mistake. The ribbon’s tangled state is a clear warning; ignoring it leads to a stream of whipsaw losses as price oscillates without direction.
Using too many EMAs: Adding ten or more EMAs creates visual noise rather than clarity. Five to eight covers all the information you need. Beyond that, the ribbon becomes difficult to read and slower to respond to transitions.
Confusing compression with reversal: A compressing ribbon signals weakening momentum. It does not confirm a reversal until the faster EMAs actually cross below the slower ones. Exiting too early on compression alone means cutting valid trends short. Wait for the cross before treating it as a trend-ending signal.
How to Build the EMA Ribbon in Arrow Algo
Arrow Algo’s drag-and-drop builder lets you construct a ribbon strategy entirely through visual blocks — no code required.
Add five EMA blocks to your canvas, setting periods to 8, 13, 21, 34, and 55 respectively. All use closing price as the input. To build a trend entry rule, connect the EMA-8 and EMA-55 outputs to a Cross Over block. When the fastest EMA is above the slowest, the ribbon is in its bullish orientation — use this as a gate to enable trend-following entries from other signals.
For a compression filter, add a condition block that checks whether EMA-8 and EMA-21 are within a defined percentage of each other. When they are converging, block new entries. This replicates the visual “tangled ribbon” check in systematic form.
Run the ribbon strategy through Arrow Algo’s backtester across multiple assets and timeframes to find the configurations where the fanning and compression signals are most reliable for your target market.
What Are the Key Takeaways?
- The EMA ribbon uses five or more EMAs to show trend direction and momentum strength simultaneously
- An ordered, fanning ribbon signals high-conviction trend conditions — the best state for trend-following entries
- A tangled or compressing ribbon signals ranging or weakening conditions — trend-following should be off
- Common periods: 8, 13, 21, 34, 55 — spaced to give clear visual separation between fast and slow trend behaviour
- The ribbon transition from tangled to re-ordered is the reversal confirmation signal, more reliable than a single crossover
- Arrow Algo’s no-code builder lets you implement ribbon logic using EMA and condition blocks without writing a line of code
Disclaimer: This content is for educational purposes only and does not constitute financial advice. Trading involves significant risk and you should only trade with capital you can afford to lose. Past performance is not indicative of future results. Always conduct your own research before making any trading decisions.
Ready to build your own automated trading strategies without writing a single line of code? Start for free at Arrow Algo and join thousands of traders who’ve made the switch to systematic trading.