
Fisher Transform Reversal Strategy: A Testable Blueprint
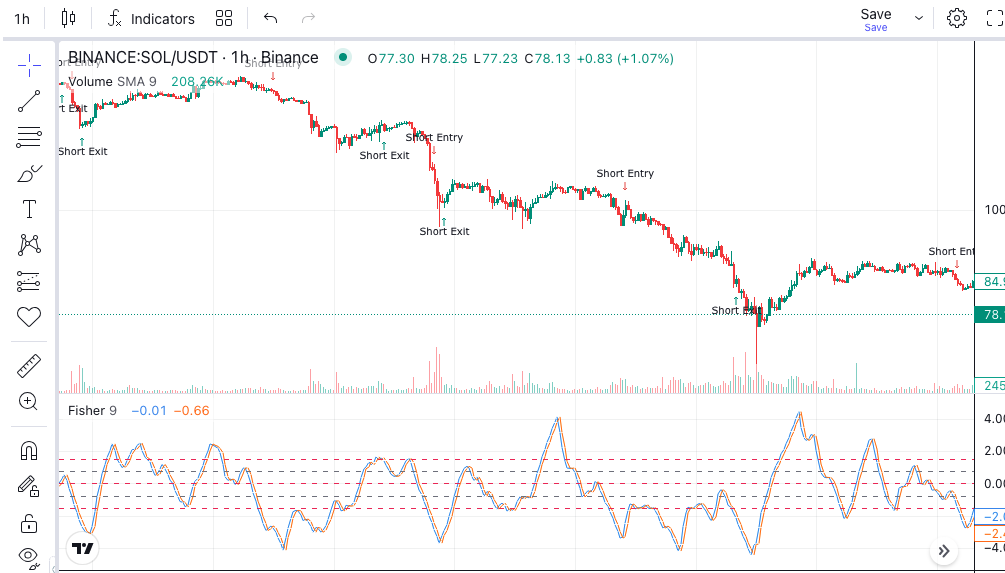
A Fisher Transform reversal strategy tries to buy exhaustion and sell euphoria. The indicator reshapes price into a distribution with sharp, well-defined extremes. Those extremes are the raw material for a reversal rule. The hard part is deciding which extreme is a turn and which is a trend that keeps going.
This guide sets out one testable version of the strategy. Every setting below is a starting point for research. No backtested performance is claimed.
Why Build a Reversal Strategy Around the Fisher Transform?
Most oscillators have fuzzy edges. RSI can sit at 75 for weeks in a strong trend. Stochastic flattens against its ceiling. Traders respond by adding more thresholds, and the rule set grows.
The Fisher Transform has a different shape. It compresses prices into a bounded range and then stretches that range so the tails stand out. Readings beyond +1.5 or below -1.5 are rare by construction. When they appear, they appear quickly and reverse quickly.
That sharpness is the appeal for a reversal trader. The turning point is often visible on the indicator one or two candles before it shows on price. John Ehlers, who created the indicator, describes this in his original paper on the Fisher Transform. Our Fisher Transform complete guide covers the background in more depth.
What Does the Fisher Transform Do to Price Data?
The calculation runs in three plain steps.
First, it finds where the current midpoint price sits inside the recent high-low range. A reading near the top of the range becomes a value near +1. A reading near the bottom becomes a value near -1. The default lookback is 9 or 10 periods.
Second, it smooths that value so single candles cannot flip it.
Third, it applies the Fisher Transform itself. This mathematical function converts a bounded value into something close to a normal, bell-shaped distribution. Values near the middle barely change. Values near the edges get pulled outward. That is why the indicator spikes at turns.
The indicator block outputs two lines. The main line is the transformed value. The signal line is the main line delayed by one period. A cross between the two is the standard trigger.
When Does an Extreme Reading Become a Reversal Signal?
An extreme reading on its own is not a signal. It is a precondition. The strategy needs two things to happen in sequence.
Step one: the stretch. The main line moves beyond a threshold. Use +1.5 and -1.5 as the first values to test. Some traders prefer +2 and -2 for fewer, cleaner setups. Investopedia’s Fisher Transform entry gives useful context on how often these levels appear.
Step two: the turn. The main line then crosses the signal line in the opposite direction. This can happen while still outside the threshold, or shortly after returning inside it. A cross down from above +1.5 is a sell setup. A cross up from below -1.5 is a buy setup.
The sequence matters. A cross near zero is noise. A cross after a stretch is the reversal the strategy is built to catch.
What Counts as “Shortly After”?
Define it in candles. A rule like “the line was below -1.5 within the last three candles, and now crosses above the signal line” is unambiguous. A rule like “recently oversold” is not, and cannot be backtested.
Three Ways to Define the Reversal Trigger
The core setup can be made stricter or looser. Compare these variations rather than picking one by instinct.
Variation A: cross only. Enter on the signal-line cross after a stretch. Fastest entry, most signals, most false starts. This is the baseline to beat.
Variation B: cross plus re-entry. Wait for the main line to cross the signal line and also cross back inside the threshold. Fewer trades, later entries, better odds that the turn is real.
Variation C: cross plus price confirmation. Add a price rule. For a buy, the close must exceed the previous candle’s high. For a sell, it must fall below the previous low. The indicator spots the turn. Price has to agree.
Run all three on the same market and window. The one with the highest return is not automatically the winner. Look at the number of trades and the size of the average loss.
How Should Exits Work When the Entry Is a Reversal?
Reversal trades have an awkward property. The entry comes at a point of maximum disagreement with the prevailing move. If the move continues, the trade is wrong immediately.
That argues for a tight initial stop. Place it just beyond the extreme candle, the one where the Fisher line peaked. An ATR-based stop of 1 to 1.5 ATR serves the same purpose and adapts to volatility.
For the target, the indicator offers a natural exit: the main line crossing zero. The stretch has unwound. The reversal has delivered what it promised. Holding beyond that point turns a reversal trade into a trend trade, which is a different strategy with different rules.
A time stop is also worth testing. If the main line has not crossed zero within, say, ten candles, the turn has stalled. Exit and wait for the next setup.
What Goes Wrong in Fisher Transform Reversal Tests?
Fighting a strong trend. In a persistent move the Fisher line can hit +1.5 and cross down. A few candles later it hits +1.5 again. Each cross is a losing short. A trend filter helps. Only take buy reversals when a longer moving average is rising, or when ADX is below a level like 25.
Using the signal line as the whole rule. The signal line crosses constantly near zero. Without the stretch precondition, a cross-only rule is just a noisy momentum system.
Testing one timeframe. Fisher extremes on a 5-minute chart are frequent and shallow. On a daily chart they are rare and meaningful. The same threshold produces completely different strategies at different speeds.
Ignoring costs. Reversal strategies trade often and hold briefly. Fees and slippage take a larger share of each trade than in a trend system. Test with realistic costs, then raise them, and see whether the edge survives.
Reading the backtest in isolation. Count the trades. A reversal rule that fires eight times in two years has not produced enough evidence to trust.
Building the Fisher Transform Reversal Strategy in Arrow Algo
The strategy translates directly into visual blocks. No code is involved.
- Data Watcher. Set the market and timeframe. Start with a 4-hour or daily chart, where extremes carry more weight.
- Fisher Transform block. Connect the high and low outputs from the Data Watcher. Set the period to 9 or 10. The block outputs the main line and the signal line.
- Threshold condition. Add a condition block checking whether the main line was below -1.5 within the last three candles. Use the equivalent above +1.5 for the short side.
- Cross condition. Add a crossover block that fires when the main line crosses above the signal line.
- AND gate. Combine the threshold condition and the cross with an AND condition block. Both must be true.
- Optional filter. Feed an ADX block or a moving average block into a third input on the AND gate for the trend filter.
- Buy action block. Connect it to the AND output. Set position size as a percentage of balance.
- Exit rules. Add a stop-loss block using ATR, and a sell action triggered when the main line crosses above zero.
Mirror the logic for the short side if the market supports it. Then run the backtest on exchange data and compare the three trigger variations above.
Once a version has been tested and reviewed, the user decides whether to deploy it. If they do, the rules send buy and sell signals to the user’s own exchange account. The exchange decides whether to accept and execute each order.
Key Points to Carry Forward
- A Fisher Transform reversal strategy needs two events: a stretch beyond a threshold, then a signal-line cross.
- Define “recently extreme” in candles, not in words, so the rule can be tested.
- Compare cross-only, cross-plus-re-entry and cross-plus-price-confirmation on the same data.
- Keep stops tight and let the zero-line cross define the natural target.
- Add a trend filter, use realistic costs, and check the trade count before trusting any result.
- Every block above exists in Arrow Algo’s visual builder, so the whole test can be run without writing code.
Disclaimer: This content is for educational purposes only and does not constitute financial advice. Trading involves significant risk and you should only trade with capital you can afford to lose. Past performance is not indicative of future results. Always conduct your own research before making any trading decisions.
Ready to build your own automated trading strategies without writing a single line of code? Start for free at Arrow Algo and join thousands of traders who've made the switch to systematic trading.