
Heikin Ashi Trend Strategy: How to Build It in Arrow Algo
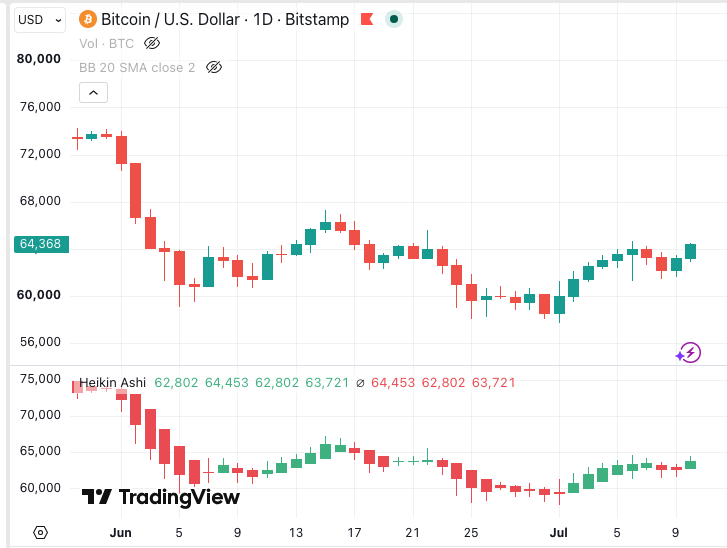
A heikin ashi trend strategy solves the problem that kills most trend followers: getting shaken out early. Standard candles show every twitch of the market. One red bar in a healthy uptrend is often enough to scare a discretionary trader out of a position that had another 20% to run. Heikin ashi candles average that noise away. The result is a chart where trends appear as long, unbroken runs of one colour, and the decision to stay in becomes mechanical rather than emotional.
How Do Heikin Ashi Candles Rewrite the Chart?
Heikin ashi means “average bar” in Japanese, and that is exactly what each candle is. The close of a heikin ashi candle is the average of the bar’s open, high, low, and close. The open is the midpoint of the previous heikin ashi candle’s body. The high and low stretch to the most extreme of the real high, real low, and the synthetic open and close.
Two things follow from that construction. First, each candle inherits half its identity from the previous one. This chains the bars together and smooths the sequence. Second, the printed prices are synthetic. No trade ever happened at a heikin ashi close. That detail matters later, because your orders fill at real prices, not averaged ones.
We covered the mechanics in depth in our heikin ashi complete guide. This post is about turning those smoothed candles into a working trend system.
What Do the Candle Colours Actually Signal?
Reading heikin ashi is a study in three states. A strong uptrend prints consecutive green candles with flat bottoms — no lower wicks. The trend is pushing hard enough that price never dips below the synthetic open. A strong downtrend is the mirror image: red candles with no upper wicks.
The third state is transition. Small bodies with wicks on both sides mean the averaging is finding balance between buyers and sellers. These doji-like candles cluster near trend turns. They are not a reversal signal on their own. They are a warning that the run is losing its one-sided character.
Which Heikin Ashi Trend Rules Are Worth Automating?
The core system is simple to state. Enter long after a set number of consecutive green heikin ashi candles, ideally wickless ones. Stay in while the colour holds. Exit when the candles flip red, or tighten the exit when lower wicks start appearing.
The consecutive-candle entry
Requiring two or three consecutive green candles before entry filters out one-bar noise. A single colour flip in chop means little. Three in a row means the averaged buying pressure has persisted across multiple bars. The trade-off is entry lag: you give up the first leg of the move in exchange for far fewer false starts.
The wick-quality filter
A refinement that costs nothing to add: only count candles that close green and have no lower wick. Wickless green candles are the strongest signal heikin ashi produces. Trends that begin with them tend to travel further than trends that begin with hesitant, wicky bars.
The colour-flip exit
Exit on the first red candle, or on the second if you want to hold through minor pauses. Because heikin ashi already smooths noise, the first genuine colour flip carries more information than a single red candle on a standard chart. Pair it with a hard stop-loss at a real price level, because the flip exit alone has no defined worst case.
What Trips Up Heikin Ashi Traders?
The biggest mistake is backtesting fills at heikin ashi prices. The candles are synthetic. If your test assumes you sold at the heikin ashi close, your results are fiction — real fills happen at market prices, which can sit meaningfully away from the averaged ones. Always execute and measure at true prices.
The second failure mode is ranging markets. Smoothing delays signals; it does not eliminate bad ones. In sideways chop, heikin ashi still flips colour repeatedly, just slightly later than regular candles. Each flip is a small loss, and they compound. A trend-strength filter such as ADX above 20-25 keeps the strategy out of conditions it was never designed for.
Finally, remember the lag cuts both ways. Heikin ashi will always turn after the actual top or bottom. This is a trend-riding tool, not a turning-point predictor. Judge it on how much of the middle of a trend it captures, not on how close to the extremes it gets.
How to Wire It Up in Arrow Algo
Arrow Algo has a dedicated Heikin Ashi block that outputs the smoothed open, high, low, and close series — no formulas needed. Drop it onto the canvas and the candle construction is handled for you.
From there the logic is a handful of visual blocks. A comparison block checks whether the heikin ashi close is above the heikin ashi open — that defines a green candle. A counter block tracks how many bars in a row that condition has held, giving you the consecutive-candle entry. An ADX block feeding a condition gate keeps entries restricted to trending regimes. For exits, the mirror comparison detects the colour flip, and an ATR-based trailing stop at real prices caps the downside the flip exit leaves open.
Backtest the assembled strategy on live exchange data from Binance, Coinbase, or HyperLiquid before risking anything. Test the two-candle and three-candle entry variants side by side. The right threshold depends on the timeframe and pair, and the backtest will tell you which one earns its lag.
The Takeaways That Matter
- Heikin ashi averages each bar and chains it to the last, turning trends into unbroken colour runs.
- Enter after 2-3 consecutive green candles; wickless bodies mark the strongest trends.
- Exit on the colour flip, backed by a hard stop at real prices.
- Never backtest fills at heikin ashi prices — they are synthetic and no trade occurred there.
- Add an ADX filter to stay out of ranges, where repeated colour flips bleed capital.
- Accept the lag: this system captures the middle of trends, not tops and bottoms.
Disclaimer: This content is for educational purposes only and does not constitute financial advice. Trading involves significant risk and you should only trade with capital you can afford to lose. Past performance is not indicative of future results. Always conduct your own research before making any trading decisions.
Ready to build your own automated trading strategies without writing a single line of code? Start for free at Arrow Algo and join thousands of traders who’ve made the switch to systematic trading.