
KDJ Indicator (Random Index): Complete Guide for Algorithmic Trading
The KDJ indicator takes the familiar stochastic oscillator and adds a third line that moves first. Traders in Chinese and other Asian markets have used it as a default momentum tool for decades. Western platforms often leave it out of the standard menu. That makes it worth a look. An algorithmic trader does not need a popular indicator. They need one whose signals are defined well enough to test. The KDJ indicator qualifies. This guide explains what the three lines are and how the fast one is built. It then turns the readings into rules you can backtest without writing code.
What Does the KDJ Indicator Measure?
The KDJ indicator is a momentum oscillator built from three lines. K and D are the same lines you find in a slow stochastic. J is the extra one. It measures how far K has pulled away from D, and it amplifies that gap.
K tells you where the close sits inside the recent high-to-low range, smoothed. D is a smoothed version of K. J is calculated from both and swings harder than either. When K and D are flat and close together, J sits between them. When K breaks away from D, J races ahead in the same direction.
The name comes from the three letters. Some platforms call it the Random Index. The Arrow Algo block uses that label. Both names refer to the same calculation.
The important difference from a plain stochastic oscillator is the J line’s range. K and D are capped between 0 and 100. J is not. It regularly prints above 100 and below 0. Those excursions are the signal most KDJ traders care about.
How Are the K, D and J Lines Built?
The calculation runs in four steps. No code is needed to follow it.
First, find the raw stochastic value. Take the lowest low and highest high over the lookback period. Nine candles is the standard. Work out where today’s close sits between them as a percentage. A close at the top of the range scores 100. A close at the bottom scores 0.
Second, smooth that raw value to get K. The classic version keeps two thirds of yesterday’s K and adds one third of today’s raw value. That is the same as a three-period smoothing.
Third, smooth K the same way to get D. Two thirds of yesterday’s D plus one third of today’s K.
Fourth, calculate J. Multiply K by three. Subtract D multiplied by two. The result exaggerates the distance between K and D. If K is 80 and D is 70, J is 100. If K is 90 and D is 70, J is 130.
The three settings are the lookback for the raw value, the K smoothing period and the D smoothing period. The default is 9, 3, 3. The Arrow Algo block exposes all three. Shorter settings make every line faster and noisier. Longer settings calm them down but delay the signal.
How Do You Interpret KDJ Readings?
There are three readings worth defining in rules.
J extremes. J above 100 means the close is pinned at the top of its range and still accelerating. J below 0 means the opposite. These are the overbought and oversold calls. A J reading beyond the band is more decisive than a stochastic K at 85. J has to move hard to get there.
K and D crosses. K crossing above D is the golden cross. K crossing below D is the dead cross. They are identical to stochastic crosses. The J line adds information about how strong the cross is. A golden cross with J above 50 and rising is one event. A cross with J still below 20 is another.
Three-line convergence. When K, D and J all meet at one level, momentum has gone flat. The next separation often starts the next move. Some traders treat the convergence as a reset and the first widening as the entry trigger.
Read the J line as the leading edge, not the confirmation. It will turn before K. K will turn before D. A strategy that waits for all three to agree is slow. A strategy that acts on J alone is early and noisy. Most rule sets use J for timing and K and D for direction.
Which KDJ Trading Strategies Work Best?
Three rule sets are worth testing before you invent your own.
Oversold Recovery
Wait for J to fall below 0. Do nothing yet. Enter long when J crosses back above 0. Exit when J crosses above 100, or on a fixed stop. This is a mean reversion entry. It works best on a pair that is in an uptrend on a higher timeframe. Add a filter that price is above its 200-period moving average. Without it, the rule buys every dip in a downtrend.
Golden Cross With J Confirmation
Enter long when K crosses above D and J is above 50. The J condition rejects crosses that happen deep in oversold territory with no momentum behind them. Exit on the dead cross. This is a trend-following entry dressed as an oscillator rule. It catches fewer bottoms than the first strategy and holds through more of the move.
J Spike as an Exit
Use any entry you already trust. Add a rule that closes the position when J moves above 100 and then crosses back below it. The second half is the key. A J reading above 100 in a strong trend can last for many candles. The cross back down is what marks the loss of acceleration. This is a profit-taking exit, not a reversal signal. Pair it with an overbought reading on the higher timeframe if you want it to fire less often.
Test each one on its own before combining them. Our guide to the stochastic oscillator covers the crossover logic that KDJ shares. The J rules are the part that is new.
Where Does the KDJ Indicator Go Wrong?
Selling every J reading above 100. In a strong trend, J will exceed 100 and stay there. A rule that shorts on the first excursion will fight the trend repeatedly. Use the cross back below 100 rather than the first touch.
Treating J like a bounded line. J above 120 and J above 100 are not the same thing. Thresholds set on one pair and timeframe do not carry to another. Check the distribution of J values on your test data before fixing a threshold.
Running 9, 3, 3 on one-minute crypto candles. The default settings were tuned for daily stock data. On fast crypto timeframes, nine candles is nine minutes. J will cross 0 and 100 dozens of times a day. Lengthen the lookback or move up a timeframe.
Duplicating the stochastic. If your strategy already has a stochastic block, adding KDJ gives you the same K and D twice. Only the J line adds anything. Decide which block you are using and remove the other.
Testing without fees. J-based rules trade often. A 0.1% round-trip fee turns a marginal edge into a losing one at that frequency. Include realistic costs from the first backtest.
How Can You Build a KDJ Strategy in Arrow Algo?
Arrow Algo’s visual builder has a dedicated KDJ block. You do not need to construct the lines yourself.
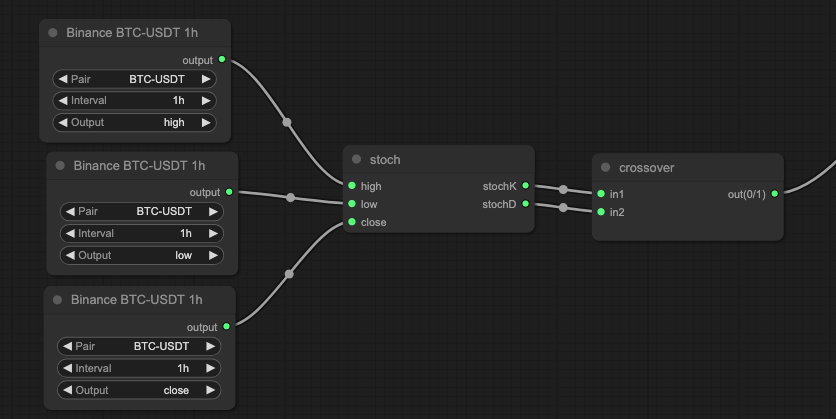
Start with three data blocks for your pair and timeframe. Set one to output the high, one the low and one the close. Connect all three to the KDJ block’s inputs. Set the three periods on the block. The defaults of 9, 3, 3 are a reasonable first test on a four-hour chart.
The block outputs three values: K, D and J. For the oversold recovery strategy, connect the J output to a crossover block. Add a fixed number block set to 0 as the other input. The crossover fires when J moves above 0. Pass that signal through a condition block that also checks the close is above a moving average. Connect the result to a Buy block.
For the exit, feed J and a fixed number block set to 100 into a second crossover block. This one checks for the cross below. Connect it to a Sell block. Add a stop loss as a separate rule so the position does not depend on J alone.
Run a backtest on real exchange data. Then change the lookback from 9 to 14 and run it again. If the result changes a lot, the strategy is sensitive to that one setting. Try a different timeframe before you trust it. The Arrow Algo backtester applies fees to every simulated trade. The high trade count of a J-based rule is priced in from the start.
What Should You Remember About KDJ?
- The KDJ indicator is a stochastic oscillator plus a third line, J, that moves first and is not capped at 0 or 100.
- J is three times K minus two times D. It exaggerates the gap between the two smoothed lines.
- J beyond 100 or below 0 marks an extreme. The cross back inside the band is a better trigger than the first touch.
- K and D crosses are the same as stochastic crosses. Use J to grade them.
- Default settings of 9, 3, 3 come from daily stock data. Adjust them for crypto timeframes.
- Trade count is high with J-based rules. Test with realistic fees from the first run.
- Arrow Algo’s KDJ block outputs K, D and J directly. Build the rules with crossover and condition blocks, no code required.
Disclaimer: This content is for educational purposes only and does not constitute financial advice. Trading involves significant risk and you should only trade with capital you can afford to lose. Past performance is not indicative of future results. Always conduct your own research before making any trading decisions.
Ready to build your own automated trading strategies without writing a single line of code? Start for free at Arrow Algo and join thousands of traders who've made the switch to systematic trading.