
Keltner Channel Trading Strategy: How to Build It in Arrow Algo
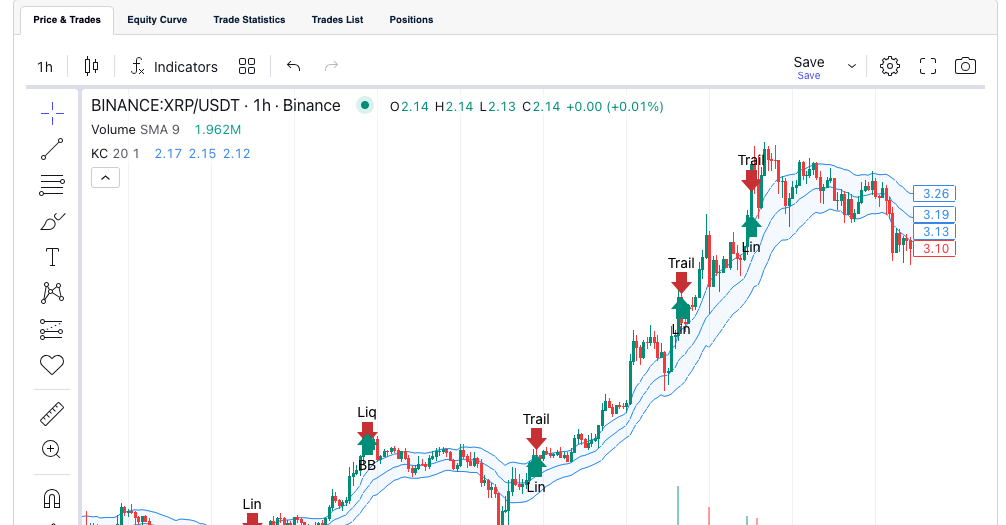
A Keltner channel strategy trades price against a volatility envelope built from two of the most trusted tools in technical analysis: an exponential moving average for direction, and the Average True Range for width. The result is a smoother, calmer cousin of Bollinger Bands — one that many systematic traders prefer precisely because it reacts less dramatically to single wild candles.
What Is a Keltner Channel Strategy?
A Keltner channel strategy uses three lines. The midline is typically a 20-period EMA. The upper and lower bands sit two ATRs above and below it. Price spending time above the midline signals an uptrend; touches of the outer bands mark unusually strong or stretched moves relative to recent volatility. Strategies built on the channel come in two families: momentum systems that buy strength through the upper band, and pullback systems that buy retreats to the midline within an established trend.
How Do Keltner Channels Differ From Bollinger Bands?
Both are volatility envelopes, but the width calculation changes their personality. Bollinger Bands use standard deviation, which squares price deviations — so one violent candle balloons the bands instantly. Keltner channels use the Average True Range, which absorbs shocks gradually. As Investopedia puts it, Keltner channels are smoother and better suited to trend identification, while Bollinger Bands excel at flagging volatility extremes. In practice that means fewer head-fake band touches in crypto’s spiky tape — and cleaner rules for automation. If you prefer the deviation-based approach, our Bollinger Band breakout strategy covers that side of the family.
What Do Band Touches Tell You?
- Close above the upper band: price moved more than two average candles beyond trend — genuine momentum, not noise.
- Riding the upper band: repeated closes along it mark the strongest trends. This is continuation, not overbought.
- Return to the midline: the normal resting point of a healthy trend — and the pullback buyer’s entry zone.
- Close below the lower band in an uptrend: the trend’s character has broken; time to be out.
Two Keltner Channel Strategies to Build
Strategy A: The Momentum Ride
- Entry: a candle closes above the upper band while price is above its 200-period EMA — strength, confirmed in the direction of the larger trend.
- Exit: a close back below the midline EMA.
- Character: breakout-style, similar in spirit to an ATR breakout system, but with a trailing structure built in.
Strategy B: The Midline Pullback
- Entry: in an uptrend (price above the 200 EMA, channel sloping up), price pulls back and touches the midline, then closes back above it.
- Stop: below the lower band — beyond it, the trend thesis is wrong.
- Target: the upper band, or trail the midline for a longer hold.
- Character: buys discounts in strength instead of chasing extension — the patient counterpart to Strategy A.
Wiring It Up in Arrow Algo
- Add a Keltner Channels block and connect your candle feed. EMA period, ATR period, and multiplier are editable properties.
- Add an EMA block (200) with a condition block as the regime filter.
- For Strategy A, use a crossover block on price and the upper band output; for Strategy B, on price and the midline.
- Route the opposite condition — midline loss or lower-band break — to your exit.
- Backtest both on live exchange data from Binance, Coinbase, or HyperLiquid across the same period and compare which suits your market’s rhythm.
Where Do Keltner Strategies Go Wrong?
- Fading the upper band by reflex. A touch of the upper band is not automatically “overbought” — in trends it is the strongest continuation signal the channel gives.
- Trading both strategies in one system. Momentum entries and pullback entries contradict each other bar to bar. Build them as separate scenarios.
- No regime filter. In flat markets the midline is noise and both band touches mean-revert. The 200 EMA filter is what keeps you out.
- Multiplier tinkering. The standard 2x ATR width is robust across markets; a backtest-perfect 1.7x is usually curve-fitting.
The Short Version
- A Keltner channel strategy pairs an EMA midline with ATR-width bands — a volatility envelope that stays calm through single wild candles.
- ATR-based width makes it smoother than Bollinger Bands and better matched to trend systems.
- Ride closes above the upper band for momentum, or buy midline pullbacks in confirmed trends — never both in one strategy.
- The midline is the natural trailing exit; the lower band is the invalidation line.
- Arrow Algo’s Keltner block makes both builds drag-and-drop — the complete Keltner channels guide has the full indicator background.
Disclaimer: This content is for educational purposes only and does not constitute financial advice. Trading involves significant risk and you should only trade with capital you can afford to lose. Past performance is not indicative of future results. Always conduct your own research before making any trading decisions.
Ready to build your own automated trading strategies without writing a single line of code? Start for free at Arrow Algo and join thousands of traders who’ve made the switch to systematic trading.