
Linear Regression Channel Strategy: How to Build It in Arrow Algo
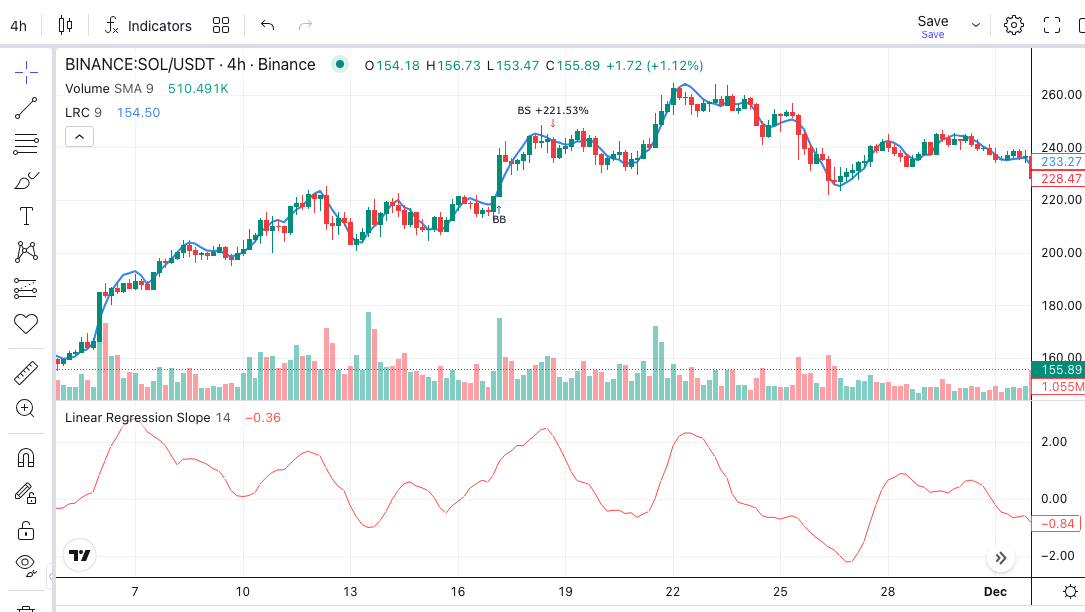
A linear regression channel strategy gives pullback entries a measurable reference: the recent trend and a defined distance around it. The centre follows a fitted price trend. The outer boundaries identify where price has moved away from that reference.
Turning those lines into a strategy requires several decisions. Which direction permits entries? What confirms a pullback has ended? Where does the trade become invalid? A useful channel makes those decisions explicit.
This guide explains conventional regression channels, then builds a clearly labelled ATR-based variation in Arrow Algo’s no-code visual builder. The example settings are starting points for testing. They are not a tested profitable system.
What Does a Linear Regression Channel Measure?
Linear regression fits a straight line through a selected window of prices. It chooses the line that minimises their total squared vertical distances from it. The fitted slope describes direction over that window.
The rolling indicator outputs the fitted line’s value at the current bar. Tulip Indicators’ linear regression reference documents this endpoint calculation. It is an estimate of the current trend value, not a forecast of tomorrow’s close.
A conventional regression channel adds parallel boundaries around the fitted line. Their distance often depends on the dispersion of prices around that same fitted line. TradingView’s channel explainer illustrates the centre and deviation bands.
An upward slope can coexist with price below the centre. That combination describes a pullback within the measured trend. Price above a downward-sloping centre can instead describe a rally within a decline.
Our linear regression indicator guide covers the basic block. Here, the focus is the entry and exit system built around it.
How Should You Set the Channel Width?
The width calculation changes the strategy. Three approaches can produce visibly different signals:
| Width method | What sets the distance | Main interpretation |
|---|---|---|
| Regression residual dispersion | Price deviations from one fitted line over the selected window | How closely prices track that fitted trend |
| Raw-price standard deviation | Price dispersion around the window’s arithmetic mean | Overall variation, including the trend itself |
| Average True Range | Recent candle ranges, including gaps | Recent movement size in price units |
Do not substitute these methods silently. A Standard Deviation block on raw closes does not automatically calculate regression residual dispersion. A standard error of the mean is also a different statistic.
The practical example below uses a 50-bar regression centre with boundaries two 14-bar ATRs away. This is a regression-centred ATR envelope. It offers a straightforward visual-block construction, but does not reproduce a conventional residual-deviation channel.
The distinction prevents misleading probability claims. Two ATRs is a distance rule. It says nothing about a 95% probability of price staying inside the boundaries.
Linear Regression Channel Strategy: Three Setups to Test
Buy a Pullback Within a Rising Trend
Require a positive regression slope. Watch for price to close below the lower boundary, then close back above it. That recovery provides a specific entry trigger instead of buying every lower-band touch.
For a simple version, require the previous close below its corresponding lower band. Require the current close above its current lower band. The slope must still be positive, and the strategy must have no open position.
This setup can lose when a pullback becomes a trend reversal. A rising fitted slope describes the recent window; it does not guarantee that the trend survives.
Follow a Confirmed Upper-Band Break
A separate version buys an upper-band breakout with a positive slope. It seeks continued expansion rather than a return towards the centre.
Keep this version separate from the pullback strategy during testing. Otherwise, the same upper-band event could mean an entry in one rule and an exit in another. Each version needs its own invalidation and position-management rules.
Trade Reversion Only in a Defined Flat Regime
A third version looks for recovery inside the channel when the fitted slope is small. A centre-line target may suit that hypothesis.
Define “small” before testing. Raw slope is measured in price units per bar, so one threshold will not transfer cleanly between assets. Dividing slope by ATR offers one way to compare direction against recent movement size.
The normalised reading still needs calibration to the selected timeframe. It is not a universal measure of trend strength.
How Can You Build the ATR-Based Version in Arrow Algo?
Start with one exchange, one pair and one candle timeframe. Use completed candles throughout the example.
- Create the centre. Feed closing prices into a Linear Regression block with a 50-bar period.
- Check direction. Feed the same closes into a Linear Regression Slope block with the same period.
- Create the width. Add a 14-bar ATR block. Multiply its output by a fixed value of two.
- Construct the boundaries. Add that width to the centre for the upper band. Subtract it for the lower band.
These blocks create the rolling endpoint values needed for decisions. They do not redraw a single historical channel across the whole chart.
Connect the Entry Conditions
Use Lag blocks to compare the previous close with the previous lower band. Compare the current completed close with the current lower band.
Combine those checks with a positive slope and a flat-position check using a Condition block set to AND. Connect the combined result to the entry logic. Confirm that the signal permits one entry, rather than repeated orders while a condition stays true.
Choose how exits work before running the test. One candidate takes profit when a later completed close reaches the rolling centre. A protective stop can sit below the signal candle’s low with a fixed ATR allowance.
Capture the initial stop when the trade begins. Do not let a later increase in ATR silently widen it. Position size should reflect the distance from the expected fill to that stop.
What Does a Worked Pullback Example Look Like?
Consider these hypothetical readings on a completed hourly candle:
- Regression centre: $100.
- ATR: $2.
- Lower boundary: $96; upper boundary: $104.
- Regression slope: positive.
Suppose the preceding candle closed below its own lower boundary. The new candle closes at $97, back above the current $96 boundary. The entry conditions are now satisfied, assuming the strategy is flat.
Suppose the signal candle’s low is $95. One illustrative stop places the invalidation half an ATR below that low, at $94. With a hypothetical $97 fill, the initial price risk is $3 per unit.
A hypothetical $30 risk allowance therefore permits ten units before fees and slippage. If the centre remained $100, reaching it would offer $3 per unit gross. Costs would reduce that result, and the rolling centre may move before an exit.
This arithmetic exposes a useful question: does the likely reward justify the initial risk? A visually tidy channel cannot answer that by itself.
Which Testing Mistakes Distort the Results?
Redrawing the past. A channel fitted to the latest window can make earlier entries look obvious. Recalculate each historical decision using only the data then available. Read our look-ahead bias guide for common timing traps.
Assuming a signal-close fill. A completed candle’s signal becomes known at its close. Model a subsequent executable fill unless the test explicitly supports another valid execution process.
Recalculating stops without limits. Wider volatility bands should not automatically increase an existing trade’s maximum planned loss. Test stop behaviour separately from entry-band behaviour.
Selecting one lucky period. Compare a few sensible neighbouring lookbacks rather than hundreds of combinations. Keep a later period untouched for evaluation after choosing the rules.
Ignoring trading costs. Include fees, spread and slippage. For perpetual positions, also assess funding. If the backtester omits a cost, account for it separately before interpreting profitability.
Linear Regression Channel Strategy: Final Checks
- Use slope for direction and price position for the entry setup.
- State exactly how channel width is calculated.
- Treat the ATR construction as its own variation, with its own test results.
- Keep pullback, breakout and flat-market versions separate during evaluation.
- Verify candle timing, one-entry behaviour and stop handling in the trade log.
- Judge the strategy across different market conditions and an untouched test period.
Arrow Algo lets you express these rules with drag-and-drop visual blocks. The benefit is a repeatable process you can inspect and challenge. Whether that process has an edge remains a question for testing.
Disclaimer: This content is for educational purposes only and does not constitute financial advice. Trading involves significant risk and you should only trade with capital you can afford to lose. Past performance is not indicative of future results. Always conduct your own research before making any trading decisions.
Ready to build your own automated trading strategies without writing a single line of code? Start for free at Arrow Algo.