
Lookback Period: Choose More Reliable Settings
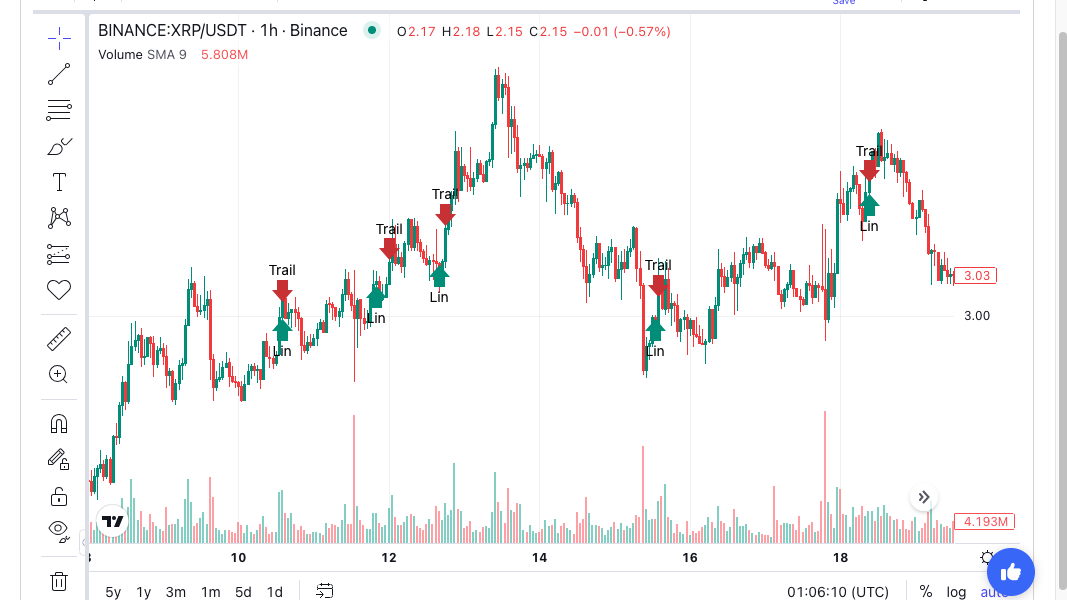
Choosing a lookback period starts with the behaviour you want to measure. A brief pullback and a month-long trend need different amounts of history. Copying the number 14 or 50 without checking the timeframe can change the strategy entirely.
There is no universal best setting. A useful choice has a clear purpose, tolerates small changes and survives testing on unseen data.
What Is a Lookback Period?
A lookback period is the amount of past data an indicator uses or emphasises. For a simple moving average, it specifies an exact rolling window.
A 20-period simple average on hourly candles uses 20 closing prices. The same setting on daily candles uses 20 daily closes. The number stays unchanged, but the observation horizon becomes much longer.
An exponential moving average works differently. Its period controls the weighting of recent and older observations. It does not abruptly discard everything beyond a fixed window. CME Group explains these moving-average differences.
The setting also differs from your backtest length. A strategy can use a 20-candle indicator and still require years of historical testing.
Why Can a Sensible Number Become the Wrong Setting?
Indicators receive candles, not your intended holding period. Changing candle duration changes what the same numeric setting describes.
On a continuously traded market, these examples show the difference:
| Indicator setting | Candle duration | Window represented by a simple average |
|---|---|---|
| 20 periods | 15 minutes | Five hours |
| 20 periods | One hour | 20 hours |
| 20 periods | Four hours | 80 hours |
| 20 periods | One day | 20 days |
Shorter settings generally react faster to new information. They can also produce more reversals and signals. Longer settings usually smooth fluctuations but react later.
That trade-off has costs. More signals can mean more fees. Slower signals can miss part of a move. Judge the complete strategy, rather than the smoothness of its chart.
How Do You Choose a Lookback Period From the Trading Idea?
Start by writing the intended behaviour in ordinary language. For example: identify a multi-day trend, then enter during a shorter recovery.
That idea suggests separate horizons for direction and timing. It does not require every indicator to share the same period.
A trend average might use several days of observations. A pullback indicator might respond to only a few candles. An exit rule may need a different horizon again.
Assign each setting a job before choosing its value. If two indicators perform the same job, adding both may provide little useful information.
Defaults offer convenient starting points. They do not establish suitability for your market, timeframe or costs. Record why you chose each initial setting so later changes remain accountable.
Can You Rescale Settings When Changing Timeframes?
You can preserve an approximate time horizon by changing the number of candles. Consider a 24-hour window in a market trading continuously.
| Candle duration | Candles spanning 24 hours |
|---|---|
| 15 minutes | 96 |
| One hour | 24 |
| Four hours | 6 |
These settings cover similar elapsed time. They do not produce identical indicators or entry signals.
A four-hour close discards the intermediate hourly closes. Highs, lows and volume also aggregate differently. Threshold crossings can therefore change even when the overall horizon matches.
For exponential averages, matching nominal duration also leaves differences in weighting and sampling. TradingView’s moving-average documentation explains the underlying smoothing choices.
Use rescaling to form a new hypothesis. Rerun the test on the new timeframe. For markets with trading sessions, distinguish elapsed hours from actual trading bars.
What Should a Small Parameter Comparison Tell You?
Suppose your initial hypothesis uses a 20-period trend average. Compare a small set such as 16, 20 and 24.
Those numbers are illustrative. The purpose is to discover whether the strategy depends on one exact setting.
Hold the exchange, asset, date range, fees, sizing and exits constant. Change one parameter at a time during the initial comparison.
Record net return alongside trade count, drawdown and turnover. Turnover describes how much trading the strategy generates. A faster setting may look attractive before costs and disappointing afterward.
Look for a Stable Neighbourhood
Several nearby settings producing broadly similar behaviour provide stronger evidence than one isolated winner. This still does not prove future profitability.
Inspect the trades behind the result. One unusually large winner can dominate an otherwise weak sample. A low trade count may leave the comparison inconclusive.
Keep a record of every setting tested. Quietly discarding failed variants makes the final winner appear more convincing than the research justifies.
Our parameter optimisation guide explores the wider process of comparing strategy inputs.
How Much History Should You Reserve for Validation?
Separate indicator warm-up from evaluation history. Warm-up supplies enough earlier observations for indicators to initialise. Evaluation history contains the trades you assess.
A 200-period setting needs sufficient earlier data. Exponential smoothing can require additional history for its initialisation effects to diminish. Check how your testing software handles that process.
Then reserve a later, untouched period for validation. Include different market conditions where data allows. Repeatedly adjusting settings against that reserved period makes it part of development.
Do not keep searching until the holdout looks profitable. That defeats its purpose. The QuantConnect research guide discusses this testing problem and the risk of overfitting.
How Can You Apply These Choices in Arrow Algo?
Use Arrow Algo’s no-code visual builder to make each assumption visible. Start with one exchange, pair and candle duration in your Data Watcher.
Add the required indicator blocks through drag-and-drop. Set their periods according to their roles: trend, entry or exit.
Save a baseline with its dates, fees and sizing assumptions. Test the neighbouring settings while keeping those other inputs unchanged. Record the settings alongside each result.
Review individual signals as well as the summary statistics. Confirm that the indicators had sufficient warm-up and used the intended candle timing.
You decide whether a strategy is ready to deploy. If deployed, its rules send signals to your own exchange account. The exchange decides whether to accept and execute them.
Which Rules Make Period Selection More Useful?
- Choose the intended behaviour before choosing a number.
- Read the period together with the candle duration.
- Treat timeframe rescaling as a fresh test.
- Prefer stable neighbouring results over a single historical winner.
- Separate warm-up history from development and untouched validation data.
- Keep costs and all tested variants visible when judging the evidence.
A defensible lookback period has a reason beyond winning one backtest. It fits the strategy’s horizon and remains useful under careful checks.
Disclaimer: This content is for educational purposes only and does not constitute financial advice. Trading involves significant risk and you should only trade with capital you can afford to lose. Past performance is not indicative of future results. Always conduct your own research before making any trading decisions.
Ready to build your own automated trading strategies without writing a single line of code? Start for free at Arrow Algo and join thousands of traders who've made the switch to systematic trading.