
MACD Crossover Strategy: How to Build It in Arrow Algo
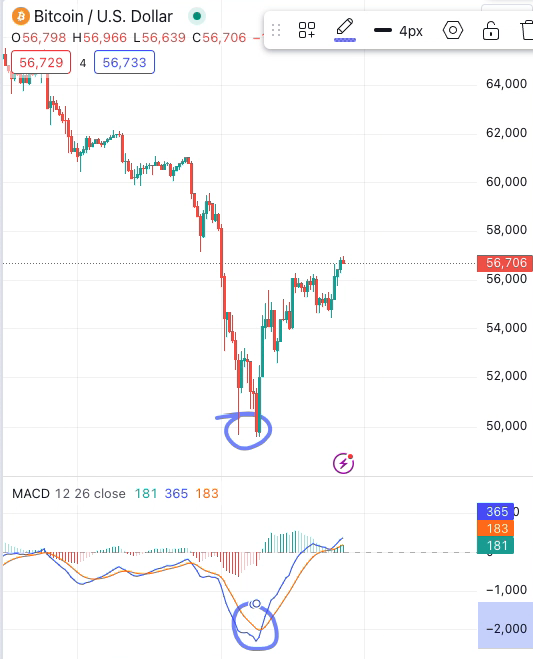
Few indicators generate as many tradeable signals as the MACD crossover — and few generate as many false ones. Understanding when crossover signals are reliable and when they are noise is what separates profitable MACD strategies from losing ones. This guide covers how the strategy works, how to filter out weak signals, and how to build it with no-code visual blocks in Arrow Algo.
What Is the MACD Crossover Strategy?
The Moving Average Convergence Divergence (MACD) indicator has three components:
- MACD line: The difference between a fast and slow exponential moving average (default: 12-period EMA minus 26-period EMA)
- Signal line: A 9-period EMA of the MACD line itself — a smoothed version that lags slightly behind
- Histogram: The difference between the MACD line and the signal line — visualises the distance between the two
The crossover strategy is built around the relationship between the MACD line and the signal line. When the MACD line crosses above the signal line, momentum is accelerating to the upside — a potential buy signal. When it crosses below, momentum is weakening — a potential sell or exit signal.
How Do MACD Crossover Signals Work?
A bullish crossover occurs when the MACD line crosses from below to above the signal line. This indicates that the short-term average has accelerated relative to the medium-term average — recent price momentum is picking up.
A bearish crossover occurs when the MACD line crosses from above to below the signal line. This indicates that short-term momentum is fading relative to the medium-term trend.
The histogram makes these signals easy to read visually: when it transitions from negative to positive, that is a bullish crossover; negative to positive, bearish. Watch the histogram bars shrink toward zero — the crossover typically occurs at the zero line.
For a comparison with a momentum approach that uses RSI instead of MACD, see the RSI + moving average strategy guide.
Signal Line Crossovers vs Zero Line Crossovers
There are two distinct types of MACD crossover, and they serve different purposes:
Signal line crossover (MACD crosses the signal line): The more common signal. Triggers early in a momentum shift. Higher frequency, more sensitive, and — in ranging markets — more prone to false positives. Use for entry timing.
Zero line crossover (MACD line crosses zero): A stronger, rarer signal. When the MACD line crosses above zero, the fast EMA has crossed above the slow EMA — the trend has flipped bullish at the moving average level. Fewer signals, higher conviction, enters trends later but with more structural confirmation. Use as a directional filter.
A common approach combines both: only take signal line crossovers when the MACD line is already above zero (confirming the broader trend). This reduces false entries in downtrends significantly.
How to Cut Down on False Crossover Signals
MACD crossovers in sideways, choppy markets produce a stream of whipsaws — the lines cross repeatedly without any sustained follow-through. This is the strategy’s primary weakness.
Three filters that reduce noise:
Zero line filter: Only take bullish signal line crossovers when the MACD line is above zero. Only take bearish crossovers when it is below zero. This aligns your trade direction with the dominant trend, eliminating counter-trend signals.
ADX confirmation: Add an ADX block and only take crossover signals when ADX is above 20. Below 20 indicates a ranging market where MACD crossovers are unreliable. This single addition can significantly improve signal quality.
Candle close confirmation: Do not enter the moment the lines cross. Wait for the current candle to close with the MACD line still above the signal line. Many false crossovers reverse within the same candle — confirming on close eliminates most of them.
What Mistakes Do MACD Traders Make?
- Trading every crossover without context: MACD generates crossovers constantly, including in choppy, directionless markets. Without a trend filter, the false positive rate in these conditions is high enough to erode any edge.
- Treating the histogram peak as the entry signal: The histogram peaks before the crossover occurs. Some traders enter on the histogram peak as an early signal — this increases sensitivity but also increases the number of false entries. Better to wait for the actual crossover with candle confirmation.
- Using default parameters for all assets and timeframes: MACD(12,26,9) is designed for daily charts of traditional assets. On crypto hourly charts, the parameters often need adjustment — shorter periods for more responsive signals, longer periods to reduce noise.
- No stop loss: MACD can stay in a bullish crossover for many candles during a strong trend, then reverse sharply. Define a stop loss before entry — ATR-based stops work well for MACD strategies.
How to Build the MACD Crossover Strategy in Arrow Algo
Arrow Algo’s no-code visual block builder lets you assemble this strategy entirely through drag-and-drop.
Add your indicators:
- MACD block — outputs MACD line and signal line separately. Set the fast period (default 12), slow period (default 26), and signal period (default 9).
- ADX block — for the trend-strength filter (optional but recommended)
Entry logic (long):
- Crossover block: MACD line crossing above signal line — bullish crossover condition
- Condition block: MACD line output is greater than 0 — zero line filter
- Condition block: ADX output is greater than 20 — trend strength filter
- Connect all three to an AND block — entry fires only when all conditions are true simultaneously
Exit logic:
- Crossover block: MACD line crossing below signal line — bearish crossover
- Or use an ATR-based trailing stop on the entry block for a dynamic exit
Run a backtest, compare results with and without the ADX filter, and adjust MACD periods to suit your asset and timeframe. The MACD indicator was developed by Gerald Appel in the late 1970s and remains one of the most studied momentum tools in systematic trading.
Key Takeaways
- The MACD crossover strategy enters when the MACD line crosses above the signal line (bullish) or below it (bearish)
- Signal line crossovers are frequent and sensitive; zero line crossovers are stronger and rarer — use both together
- Only take bullish crossovers when MACD is above zero to filter out counter-trend signals
- Add an ADX filter (ADX > 20) to avoid whipsaws in ranging markets
- Wait for candle close confirmation before entering — most false crossovers reverse intrabar
- Build and backtest the full strategy in Arrow Algo’s no-code visual block builder
Disclaimer: This content is for educational purposes only and does not constitute financial advice. Trading involves significant risk and you should only trade with capital you can afford to lose. Past performance is not indicative of future results. Always conduct your own research before making any trading decisions.
Ready to build your own automated trading strategies without writing a single line of code? Start for free at Arrow Algo and join thousands of traders who’ve made the switch to systematic trading.