
Maximum Adverse Excursion (MAE): Better Stop-Losses for Algo Traders
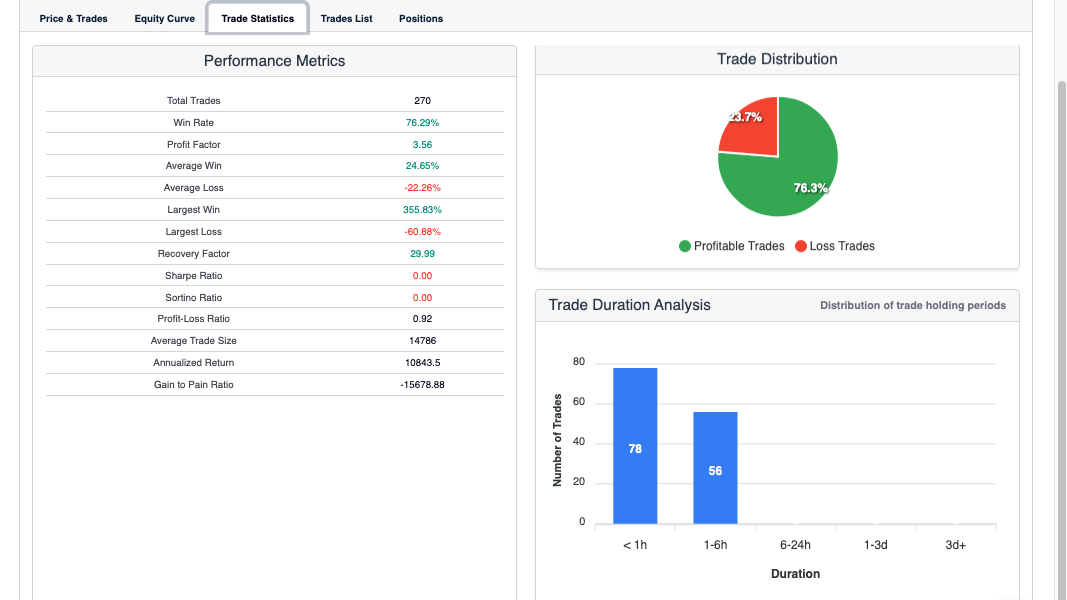
Maximum adverse excursion (MAE) is the measurement that turns stop-loss placement from guesswork into a data-driven decision. Instead of setting a stop at an arbitrary percentage or a round number, MAE uses your own backtest history to answer a precise question: how far against you did each winning trade actually move before it came good? The answer, drawn from hundreds of trades, gives you the evidence to set stops that protect capital without cutting winners short.
What Is Maximum Adverse Excursion (MAE)?
Maximum adverse excursion is the largest intra-trade drawdown a position experiences between entry and exit. For every trade in a backtest, it captures the worst point reached — the maximum distance price moved against the position before the trade eventually closed.
If you enter a long trade at $100 and price drops to $96 before recovering and closing at $105, the MAE for that trade is -4% (or -$4). If price never dropped below $99 before closing at $105, the MAE is -1%.
Analysed across all trades in a backtest, MAE produces a distribution: how much heat each trade absorbed before its outcome was determined. That distribution is where the strategic value lies.
Why MAE Matters for Stop-Loss Placement
Most stop-losses are set by intuition — 1%, 2%, a recent swing low — without reference to the actual behaviour of the strategy. MAE replaces that intuition with evidence.
The insight that makes MAE useful is that winning trades and losing trades tend to behave differently. Winning trades typically experience relatively modest adverse excursions before turning profitable. Losing trades tend to push further against the entry and keep going. When you plot the MAE distribution for winners separately from losers, you often find a natural threshold: a level below which most winners never fell, and beyond which most losers continued to go.
Setting a stop at that threshold catches the majority of losers early while preserving the majority of winners. A stop set tighter than the winners’ natural noise will cut profitable trades prematurely. A stop set wider than necessary keeps losing trades running far longer than needed.
How to Read the MAE Distribution
Run a backtest across a meaningful sample — at minimum a few hundred trades. For each trade, record the MAE value. Separate these values into two groups: winning trades and losing trades.
Plot the two distributions and look for divergence. If 90% of winning trades had an MAE of less than -2%, and 80% of losing trades had an MAE of more than -2.5%, then a stop near -2% to -2.5% is well-calibrated for that strategy. You would preserve most winners and cut most losers relatively early.
If the two distributions heavily overlap — winners and losers both experiencing similarly large adverse excursions — the entry signal itself may not be generating meaningful edges. MAE analysis can surface this structural problem before it manifests in live losses.
What Is the Relationship Between MAE and MFE?
MAE has a natural counterpart: Maximum Favorable Excursion (MFE). Where MAE measures the maximum move against a position, MFE measures the maximum move in the position’s favour before it closes. The two together give a complete picture of how trades behave between entry and exit.
MFE analysis answers: how much room does a typical winner need before it starts to reverse? If 80% of winning trades reach at least +3% before closing, a take-profit set at +2% may be cutting winners before they fully develop. Setting the take-profit closer to the MFE distribution’s natural peak captures more of the typical winning trade’s potential.
Building entry and exit rules around both MAE and MFE produces a strategy calibrated to its own historical behaviour — stops that give winners room to breathe without absorbing excessive loss on losers, and targets that capture meaningful returns without closing out early.
What Are the Limits of MAE Analysis?
Sample size: MAE analysis on 50 trades produces unreliable distributions. Patterns only become statistically meaningful at several hundred trades or more. Strategies that trade infrequently may need years of backtest data to generate a sufficient sample.
Regime dependence: A stop derived from a bull market MAE analysis reflects bull market conditions. If the strategy is deployed in a ranging or bear market, the MAE distribution may shift significantly. Walk-forward testing across different market regimes validates whether the derived stop level holds outside the period it was built on.
Gap risk: MAE assumes continuous price movement. In crypto, sudden adverse gaps can breach a stop set at the MAE threshold before execution occurs. Build in a buffer beyond the calculated threshold to account for slippage and gap risk in live conditions.
Changing strategy behaviour: If strategy parameters change, the MAE distribution changes with them. Re-run the MAE analysis whenever the strategy is modified rather than assuming previous stop calibrations still apply.
How to Apply MAE in Arrow Algo
Arrow Algo’s backtesting engine produces a detailed trade log that includes each trade’s entry price, exit price, and intra-trade price range. Use this output to calculate the adverse excursion for each completed trade.
Separate the MAE values for winning trades and losing trades. Identify the threshold where the two distributions diverge most clearly — this becomes the input for your stop-loss block in Arrow Algo’s visual builder. Drag a stop-loss block onto your strategy canvas, wire it to the entry signal, and set the threshold to your MAE-derived value.
Re-run the backtest with the calibrated stop and compare performance metrics before and after: win rate, average winner, average loser, and risk-adjusted return. The improvement in these metrics confirms whether the MAE analysis has produced a stop that genuinely fits the strategy’s behaviour.
For context on the broader set of metrics to evaluate alongside MAE, see our guides to how to read a backtest report and drawdown management strategies.
Key Takeaways
- Maximum adverse excursion (MAE) measures the worst intra-trade drawdown each position experiences between entry and exit.
- Winning trades tend to have smaller MAEs than losing trades — the gap between the two distributions defines the optimal stop threshold.
- Setting a stop at the natural divergence point between winner and loser MAE distributions preserves most winners while cutting most losers early.
- MAE pairs with MFE (Maximum Favorable Excursion) to calibrate both stop-loss and take-profit levels from actual trade data.
- Reliable MAE analysis requires hundreds of trades and walk-forward validation across multiple market regimes.
- Apply the derived stop level in Arrow Algo’s visual builder and retest to confirm measurable improvement in risk-adjusted performance.
Disclaimer: This content is for educational purposes only and does not constitute financial advice. Trading involves significant risk and you should only trade with capital you can afford to lose. Past performance is not indicative of future results. Always conduct your own research before making any trading decisions.
Ready to build your own automated trading strategies without writing a single line of code? Start for free at Arrow Algo and join thousands of traders who’ve made the switch to systematic trading.