
Drawdown Management in Algorithmic Trading
Drawdown management in algorithmic trading is the discipline that separates strategies that survive from those that get abandoned. Every systematic strategy experiences losing periods. The question is never whether drawdowns will happen — it is whether your approach to managing them lets you stay in the game long enough for your edge to compound. Most retail traders fail not because their strategy lacks an edge, but because they abandon it during a drawdown that, with the benefit of hindsight, was entirely normal.
What Is Drawdown Management in Algorithmic Trading?
A drawdown is the decline from a peak in the equity value of a strategy to the subsequent trough, expressed as a percentage. If a strategy’s account grows from £10,000 to £14,000 and then falls to £11,200 before recovering, the drawdown was 20% (£2,800 from the peak of £14,000). Drawdown management in algorithmic trading is the set of rules and techniques used to limit how large that decline can be and how quickly the strategy recovers from it.
According to Investopedia’s definition of drawdown, it is one of the most critical risk metrics in systematic trading — arguably more important than return in isolation, because a strategy’s return is only realised by traders who stay invested through its drawdown periods.
Why Drawdown Management Matters More Than Win Rate
A strategy with a 40% win rate can be highly profitable if losses are small and wins are large. But even a strategy with a 60% win rate can destroy an account if the occasional large drawdown triggers panic selling or forced liquidation. The psychological reality of drawdown is asymmetric: a 50% drawdown requires a 100% gain to return to breakeven. A 25% drawdown requires only a 33% gain. This mathematical asymmetry means that avoiding large drawdowns is not just about emotional comfort — it is a core return-preservation mechanism.
The other critical issue is strategy abandonment. Research consistently shows that traders who manually intervene during drawdowns — overriding their rules, reducing position size erratically, or stopping the strategy entirely — almost always do so at exactly the wrong moment: near the bottom of the drawdown, just before the recovery. An automated strategy with clearly defined drawdown limits removes this decision entirely.
The Four Core Drawdown Management Techniques
1. Maximum Drawdown Limit (Circuit Breaker)
Define the maximum drawdown percentage your strategy is permitted to experience before it pauses automatically. A common setting is 20–25% from the peak. If the strategy hits this level, it stops entering new trades until you manually review and reset it. This circuit breaker prevents a struggling strategy from continuing to trade during conditions it clearly is not suited to, limiting the total damage while you diagnose the problem.
2. Volatility-Scaled Position Sizing
Reduce position size automatically when the strategy is in a drawdown. One approach: at 10% drawdown, reduce position size by 30%. At 15%, reduce by 50%. At 20%, stop entirely. This means the strategy naturally risks less capital when conditions are difficult, limiting how deep the drawdown can go, while scaling back up as performance recovers. The recovery phase is gentler because position sizes are still reduced, preventing over-exposure just as the strategy rebounds.
3. Drawdown-Adjusted Holding Periods
Some strategies perform well in trending conditions and poorly in ranging ones. Rather than running the same strategy identically regardless of conditions, build in a rule that reduces holding period or position size when recent performance has been poor — a sign that conditions may not suit the strategy’s edge. This is not curve-fitting; it is systematic acknowledgement that market regimes change.
4. Strategy Correlation Management
Running multiple strategies simultaneously reduces drawdown if those strategies are uncorrelated — when one is down, another may be flat or up. The key word is uncorrelated. Running five strategies that all buy BTC on RSI oversold signals is not diversification — it is the same strategy five times. True drawdown reduction through diversification requires strategies with fundamentally different entry logic, different timeframes, or different assets.
How to Measure Drawdown Effectively
Several metrics capture different aspects of drawdown risk:
- Maximum drawdown — the single largest peak-to-trough decline in the strategy’s history. The worst case the strategy has experienced.
- Average drawdown — the mean size of all drawdowns. A more realistic picture of typical losing periods than the maximum alone.
- Drawdown duration — how long the strategy spent below its previous peak. Long durations test psychological endurance even if the depth is modest.
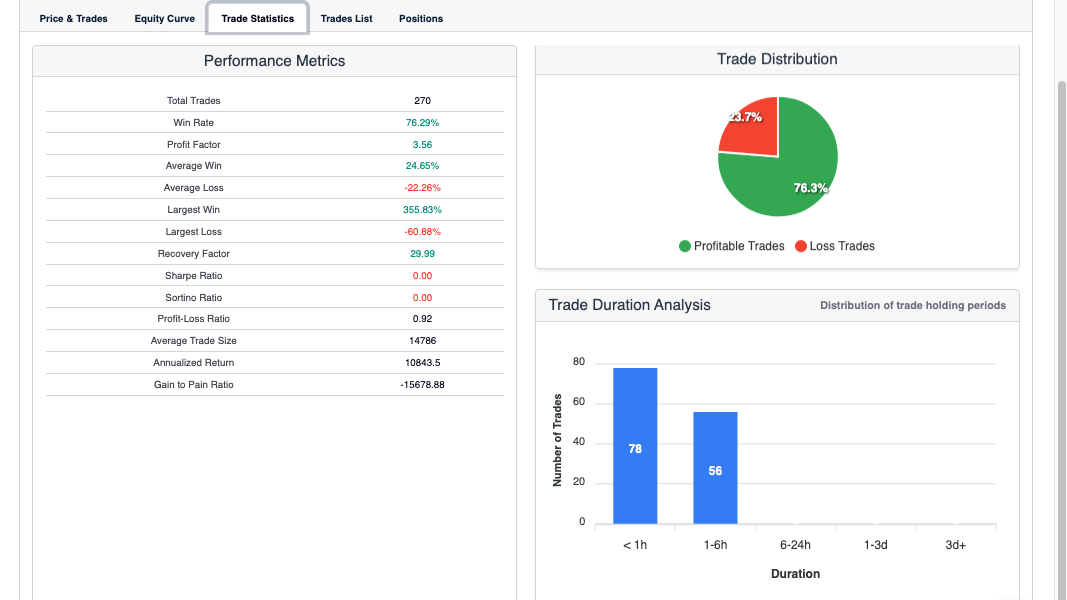
- Recovery factor — total net profit divided by maximum drawdown. A recovery factor above 3 means the strategy has generated three times its worst loss in total profits — a sign of a robust edge.
When backtesting in Arrow Algo, all of these metrics are calculated automatically. The Sharpe and Sortino ratios complement drawdown metrics by showing whether the returns justify the risk — always evaluate them together rather than in isolation.
How to Implement Drawdown Management in Algorithmic Trading with Arrow Algo
Arrow Algo’s visual block builder allows you to build drawdown management rules directly into your strategies without writing any code:
- Add a Drawdown Monitor block to track the current drawdown from peak equity in real time, with configurable alert and pause thresholds
- Connect it to a Position Size Scaling block that automatically reduces trade size as the drawdown deepens — scaling down at 10%, pausing at 20%
- Use the backtesting engine to run your strategy and examine the drawdown chart directly — seeing visually where the strategy struggled helps you calibrate your circuit breaker thresholds to realistic levels
- Run your strategy through walk-forward analysis to check whether drawdown characteristics are consistent across different market periods, or whether they were unusually bad in one specific period that may not recur
- Test multiple position sizing variants in separate backtests to find the volatility-scaled approach that produces the best Calmar ratio (annual return divided by maximum drawdown) for your specific strategy
What Are the Key Takeaways?
- Drawdown management in algorithmic trading determines whether you stay in the game long enough for your edge to compound
- A 50% drawdown requires a 100% return to recover — avoiding large drawdowns is a mathematical priority, not just a psychological one
- Circuit breakers (maximum drawdown limits) prevent a struggling strategy from compounding losses while you investigate
- Volatility-scaled position sizing automatically risks less capital during drawdowns and scales back up during recovery
- Recovery factor and drawdown duration are as important as maximum drawdown — evaluate all three together
- Arrow Algo’s visual builder lets you incorporate drawdown management rules directly into your strategy and verify their effect through backtesting
Educational disclaimer: This content is for educational purposes only and does not constitute financial advice. Trading involves significant risk and you should only trade with capital you can afford to lose. Past performance is not indicative of future results.
Disclaimer: The information provided in this article is for educational purposes only and does not constitute financial advice. Trading involves significant risk and you should only trade with capital you can afford to lose. Past performance is not indicative of future results. Always conduct your own research before making any trading decisions.
Ready to build your own automated trading strategies without writing a single line of code? Start for free at Arrow Algo and join thousands of traders who’ve made the switch to systematic trading.